
Fig. 8.
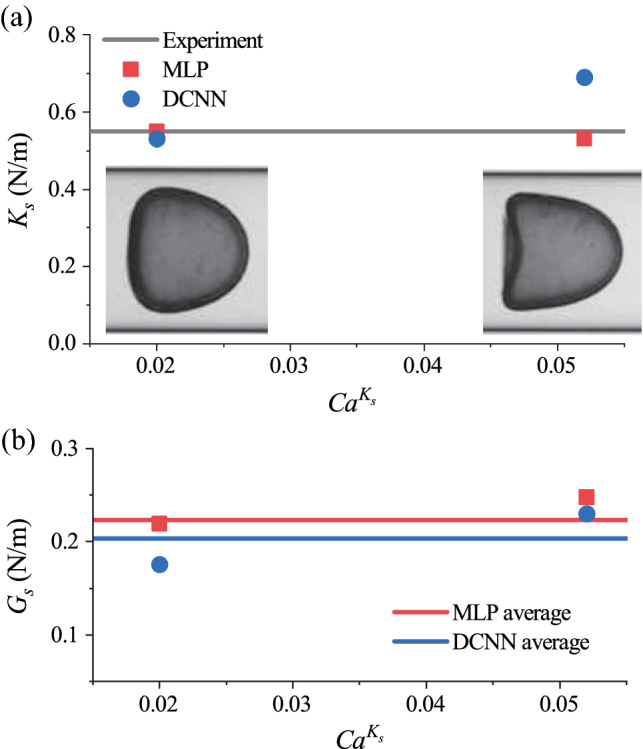
a Comparison of the predicted capsule membrane area-dilatational modulus , using the MLP and DCNN, with that reported in experiments (Risso et al. 2006). The capsule was flowed through a tube at two speeds, leading to different values of and distinct levels of deformation. Photo insets are images of steady capsule profiles at the corresponding flow speed taken from Risso et al. (2006). b Predicted membrane shear modulus by the MLP and DCNN