Fig. 3.
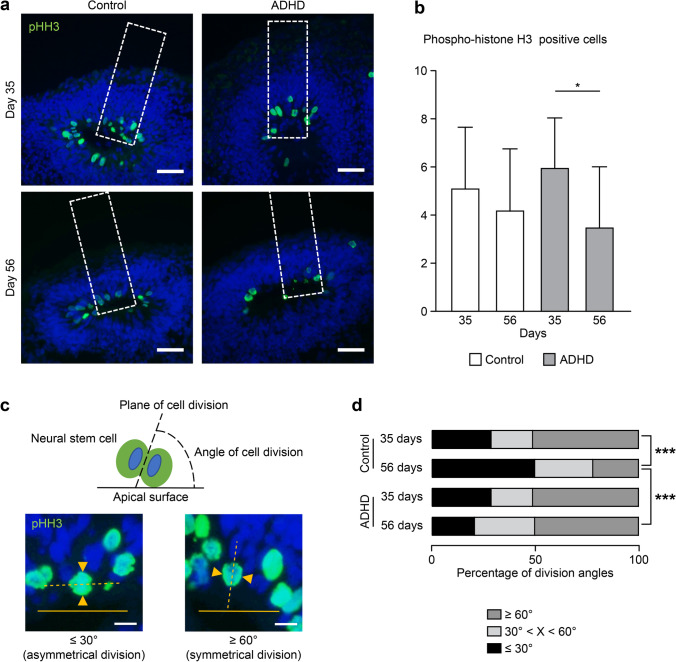
The number of cell divisions and symmetric/asymmetric divisions. (a) Cell division indicated by pHH3 in layer structures. Scale bars: 40 μm. Dotted square: ROI (60 × 200 μm). (b) The number of pHH3-positive cells. Day 35: Control (n = 26), ADHD (n = 26); day 56: Control (n = 9), ADHD (n = 9). *P < 0.05. (c) Examples of the angle of cell division. ≥ 60° was considered symmetric, and ≤ 30° was considered asymmetric. Scale bars: 10 μm. (d) Ratio of the angle of cell division. The measurement results were divided into three groups: ≥ 60° (dark gray), 30–60° (light gray), and ≤ 30° (black). day 35: Control (n = 65), ADHD (n = 65); day 56: Control (n = 32), ADHD (n = 24). ***P < 0.001

