
Fig. 4.
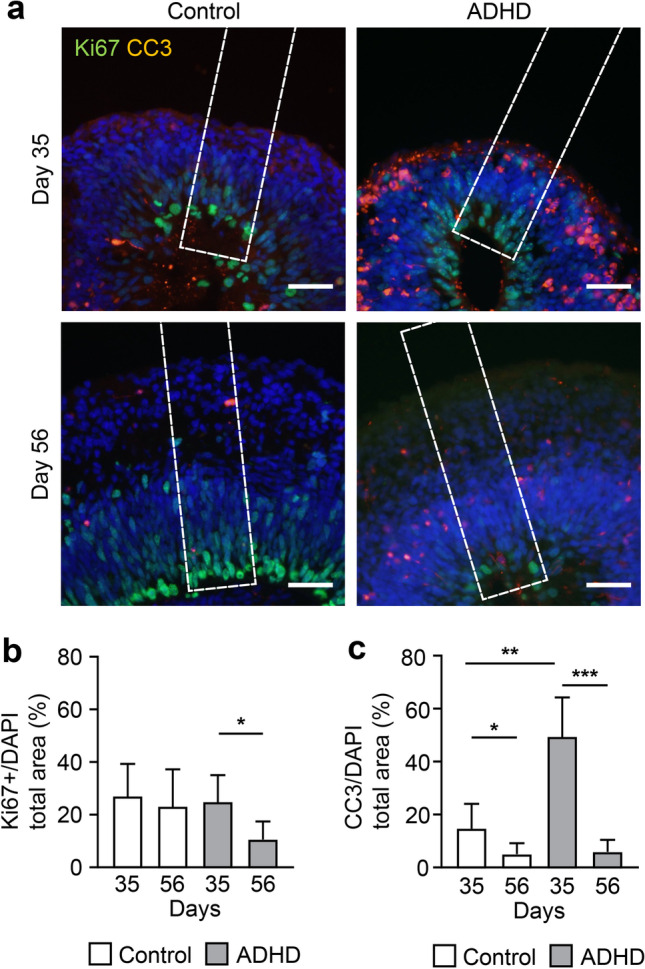
The number of cell divisions and apoptosis events. (a) Cell division and apoptosis indicated by Ki67 and cleaved-caspase 3 (CC3), respectively, in layer structures. Scale bars: 40 μm. Dotted square: ROI (60 × 250 μm). (b) Relative area of Ki67-positive cells. The Ki67-positive area was divided by the DAPI-positive area for standardization. Day 35: control (n = 19), ADHD (n = 13); day 56: control (n = 14), ADHD (n = 8). *P < 0.05. (c) Relative area of CC3-positive clusters. The CC3-positive area was divided by the DAPI-positive area for standardization. Day 35: control (n = 19), ADHD (n = 13); day 56: control (n = 14), ADHD (n = 8). *P < 0.05, **P < 0.01, ***P < 0.001