
Fig. 2.
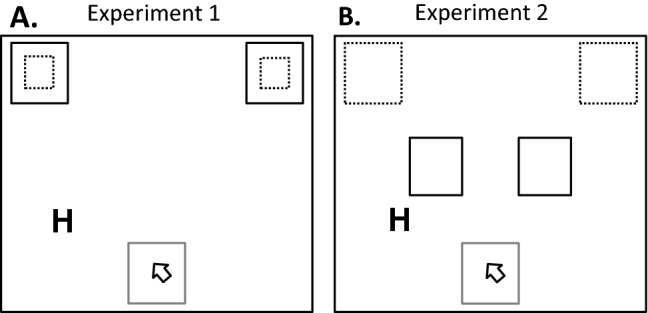
Schematic illustration of the stimulus display in Experiment 1 (A) and Experiment 2 (B). Participants had to initiate each trial by clicking into the starting box (depicted as grey squares) and after 500 ms a target letter was presented to the left or right of the screen. Participants responded by clicking into one of the two response boxes (depicted as black squares). Response boxes with solid lines were used in low motor demand blocks. Response boxes with dotted lines were used in high motor demand blocks. In Experiment 1, the size of response boxes differed by factor 3 and in Experiment 2, the distance of response boxes differed by factor 2