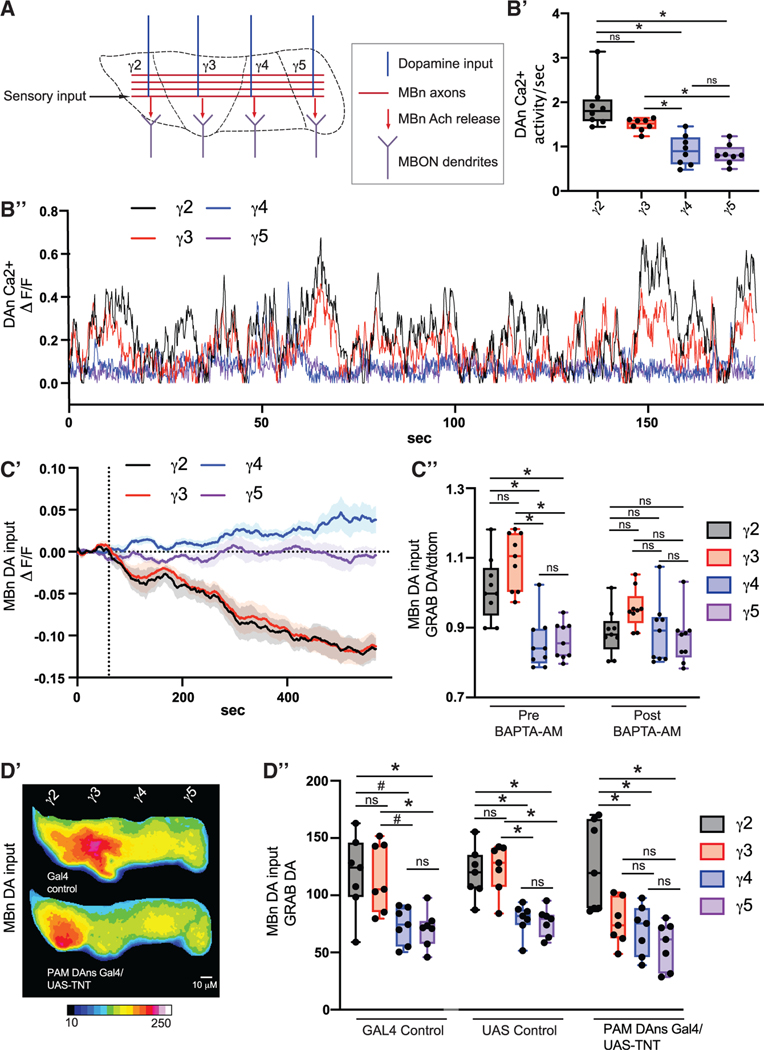
Figure 1. Level of dopamine input to MBn varies across compartments.
(A) Mushroom body anatomy cartoon.
(B) GCaMP-fusionred was expressed in all γ lobe compartment DANs using TH-gal4 and R58E02-gal4. n = 8.
(B′) Ca2+ activity was calculated by normalizingthe GCaMP signal to the RFP signal.
(B″) Example trace of Ca2+ activity.
(C) The GRAB DA sensor and tdTomato were expressed in MBn using R13F02-gal4. DA activity was calculated by normalizing the GRAB DA signal to the tdTomato signal. n = 9.
(C′) GRAB DA/tdTomato values were set to a baseline of zero for each compartment prior to 50 μM BAPTA-AM application at the 1 min mark, indicated by the vertical dotted line.
(C″) GRAB DA/tomato activity compared across compartments.
(D) The GRAB DA sensor was expressed in MBns using R13F02-lexA, and TNT was expressed in PAM DANs using R58E02-gal4. For all experiments, Gal4 control flies do not contain the UAS element, and UAS control flies do not contain gal4 element. n = 7.
(D′) Heatmap of mean time series projection of GRAB DA fluorescence for the whole recording. Scale bar, 10 μm.
(D″) GRAB DA signal was compared across compartments.
Box-and-whisker plots show the range of individual data points, with the interquartile spread as the box and the median as the line bisecting each box. *p < 0.05. (B-D) One-way ANOVA with Dunn′s test.

