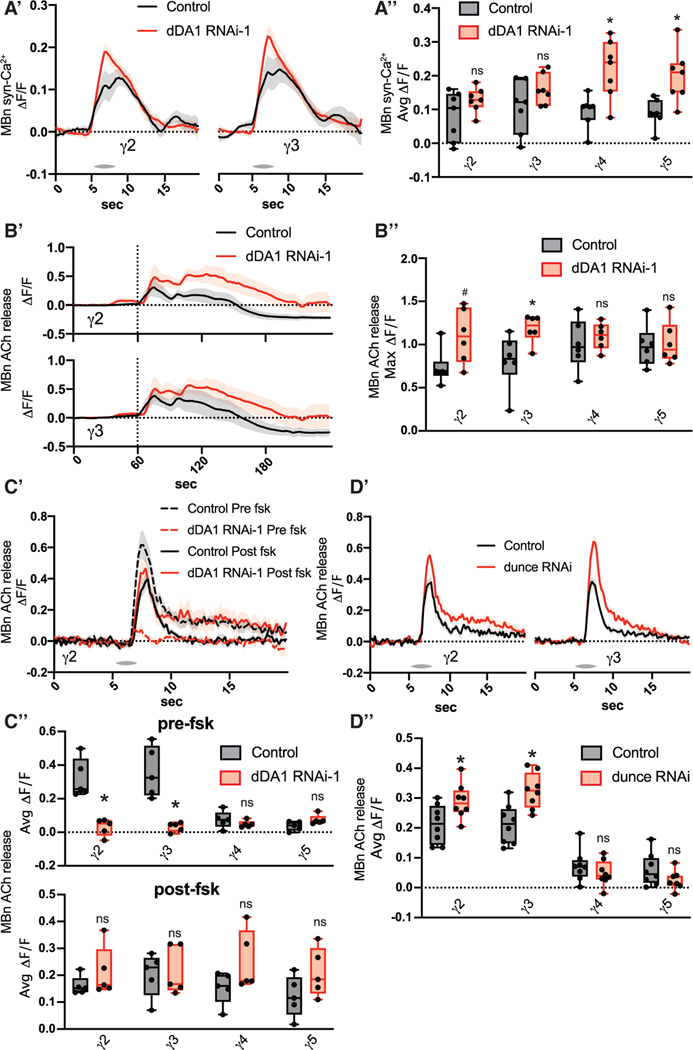
Figure 4. cAMP mediates the effects of dopamine on MBn neurotransmission.
(A) The syt-GCaMP sensor and RNAi transgenes were expressed in MBns using R13F02-gal4. n = 7.
(A′) Traces show the average odor (MCH) response (±SEM) across all flies tested in γ2 and γ3.
(A″) Average odor (MCH) responses were quantified for each compartment in γ2–5.
(B) The GRAB ACh sensor and RNAi were expressed in MBns using R13F02-gal4. Brains were dissected and imaged ex vivo in physiological saline. 100 mM KCl was bath applied at the 1 min mark. n = 6.
(B′) Traces show the average response (±SEM) across all flies tested in γ2 and γ3.
(B″) Maximum responses were quantified for each compartment in γ2–5.
(C) The GRAB ACh sensor and RNAi were expressed in MBn using R13F02-gal4. 50 mM forskolin was bath applied between the pre- and post-odor (MCH) response tests. n = 5.
(C′) Traces show the average response (±SEM) across all flies tested in γ2.
(C′′) Average odor (MCH) responses pre- and post-forskolin treatment were quantified for each compartment in γ2–5.
(D) The GRAB ACh sensor and RNAi were expressed in MBns using R13F02-gal4. n = 8.
(D′) Traces show the average odor (MCH) response (±SEM) across all flies tested in γ2 and γ3.
(D″) Average odor (MCH) responses were quantified for each compartment in γ2–5.
Box-and-whisker plots show the range of individual data points, with the interquartile spread as the box and the median as the line bisecting each box. *p < 0.05. (A-D) Mann-Whitney test.

