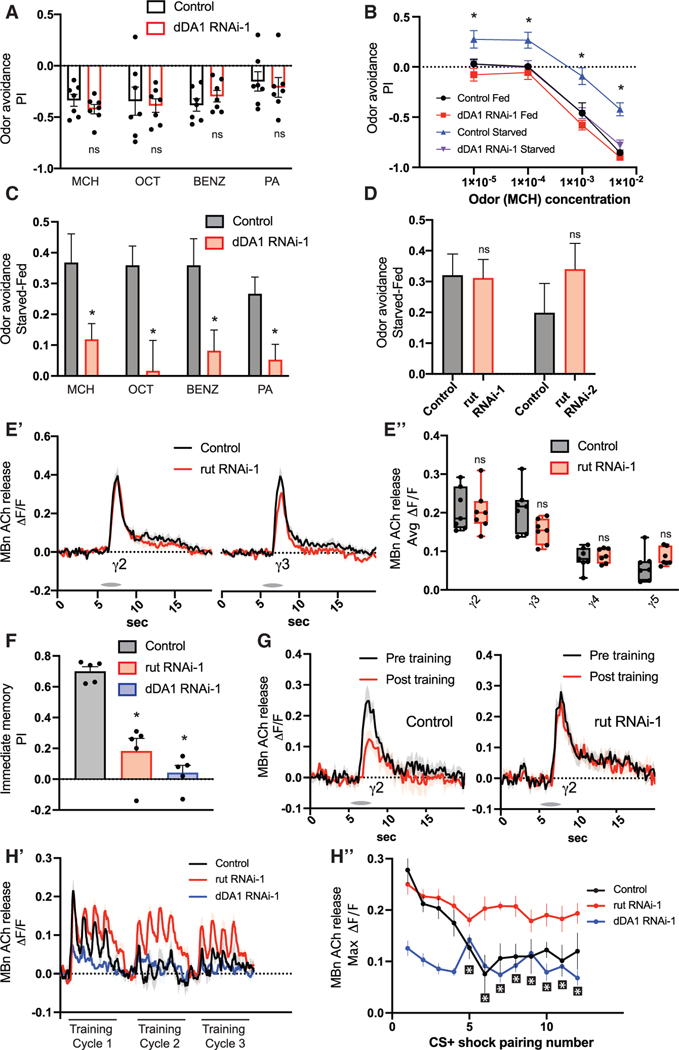
Figure 5. dDA1 controls state-dependent odor preferences and MB neurotransmission independent from rutabaga.
(A) RNAi was expressed in MBns using R13F02-gal4. The fly′s odor avoidance was tested to MCH, 3-octanol (OCT), benzaldehyde (BENZ), and pentyl acetate (PA). n = 7.
(B) Odor avoidance to various doses of MCH. n = 8.
(C) Starved-fed odor (MCH) avoidance scores. RNAi was expressed in MBns using R13F02-gal4. n = 8–10.
(D) Starved-fed odor (MCH) avoidance scores. RNAi was expressed in MBns using R13F02-gal4. n = 7–8.
(E) The GRAB ACh sensor and RNAi were expressed in MBns using R13F02-gal4. n = 7.
(E′) Traces show the average odor (MCH) response (±SEM) across all flies tested in γ2 and γ3.
(E″) Average odor (MCH) responses were quantified for each compartment in γ2–5.
(F) RNAi transgenes were expressed in MBns using R13F02-gal4. Immediate memory was tested following aversive olfactory conditioning. n = 5.
(G) The GRAB ACh sensor and rut RNAi were expressed in MBns using R13F02-gal4. Tracesshow the average response (±SEM) in γ2 to the CS+ (OCT) across all flies tested pre- and post-aversive olfactory conditioning. n = 7.
(H) The GRAB ACh sensor and RNAi were expressed in MBns using R13F02-gal4. Flies were trained with 3 rounds of 4 CS + odor (OCT) pulses paired with shock followed by 4 CS— odor (MCH) pulses. n = 7.
(H′) Traces show the average response (±SEM) to CS+/shock pairings across all flies tested in γ2. The 3 training rounds of CS+/shock were stitched together on the same graph for visualization.
(H″) Maximum odor responses were quantified for each CS+/shock pairing in γ2.
Box-and-whisker plots show the range of individual data points, with the interquartile spread as the box and the median as the line bisecting each box. *p < 0.05. (A and C-E) Mann-Whitney test. (F) One-way ANOVA with Kruskal-Wallis test.

