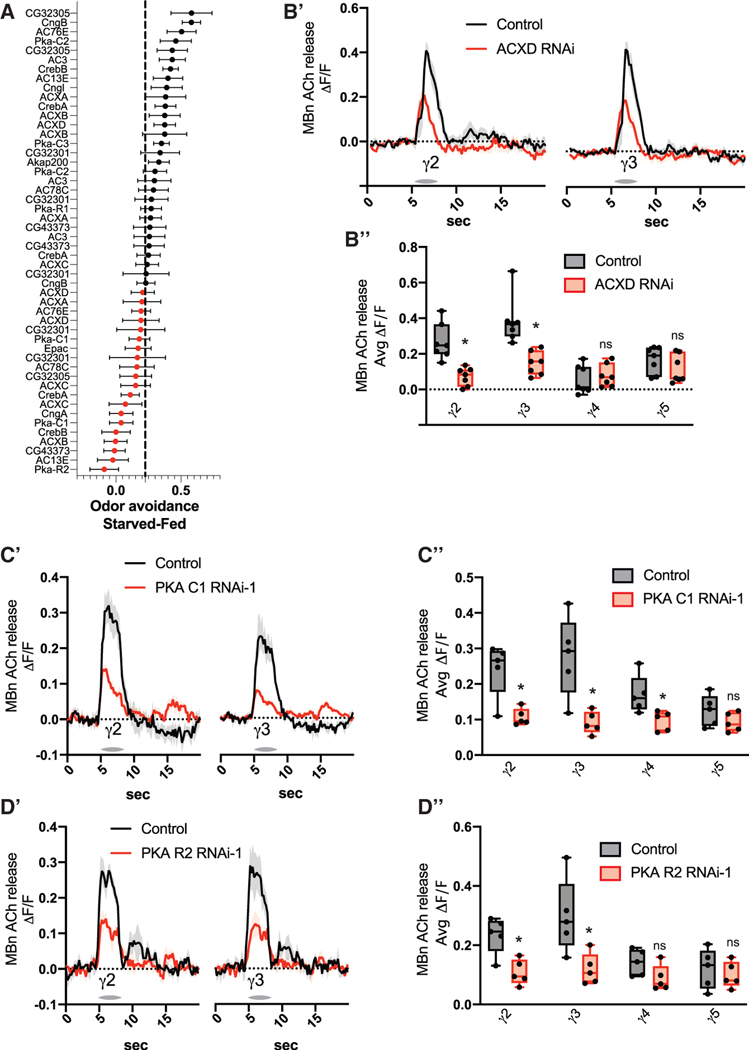
Figure 6. cAMP signaling is required for state-dependent odor preferences and MB neurotransmission.
(A) Starved-fed odor (MCH) avoidance scores. RNAi was expressed in MBns using R13F02-gal4. n = 6–10.
(B) The GRAB ACh sensor and RNAi were expressed in MBns using R13F02-gal4. n = 7.
(B′) Traces show the average odor (MCH) response (±SEM) across all flies tested in γ2 and γ3.
(B″) Average odor (MCH) responses were quantified for each compartment in γ2–5.
(C) The GRAB ACh sensor and RNAi were expressed in MBns using R13F02-gal4. n = 5.
(C′) Traces show the average odor (MCH) response (±SEM) across all flies tested in γ2 and γ3.
(C″) Average odor (MCH) responses were quantified for each compartment in γ2–5.
(D) The GRAB ACh sensor and RNAi were expressed in MBn using R13F02-gal4.
(D′) Traces show the average odor (MCH) response (±SEM) across all flies tested in γ2 and γ3. n = 5.
(D″) Average odor (MCH) responses were quantified for each compartment in γ2–5.
Box-and-whisker plots show the range of individual data points, with the interquartile spread as the box and the median as the line bisecting each box. *p < 0.05. (B-D) Mann-Whitney test.

