
Fig. 5. JAML is expressed by distinct CD8+ TILs.
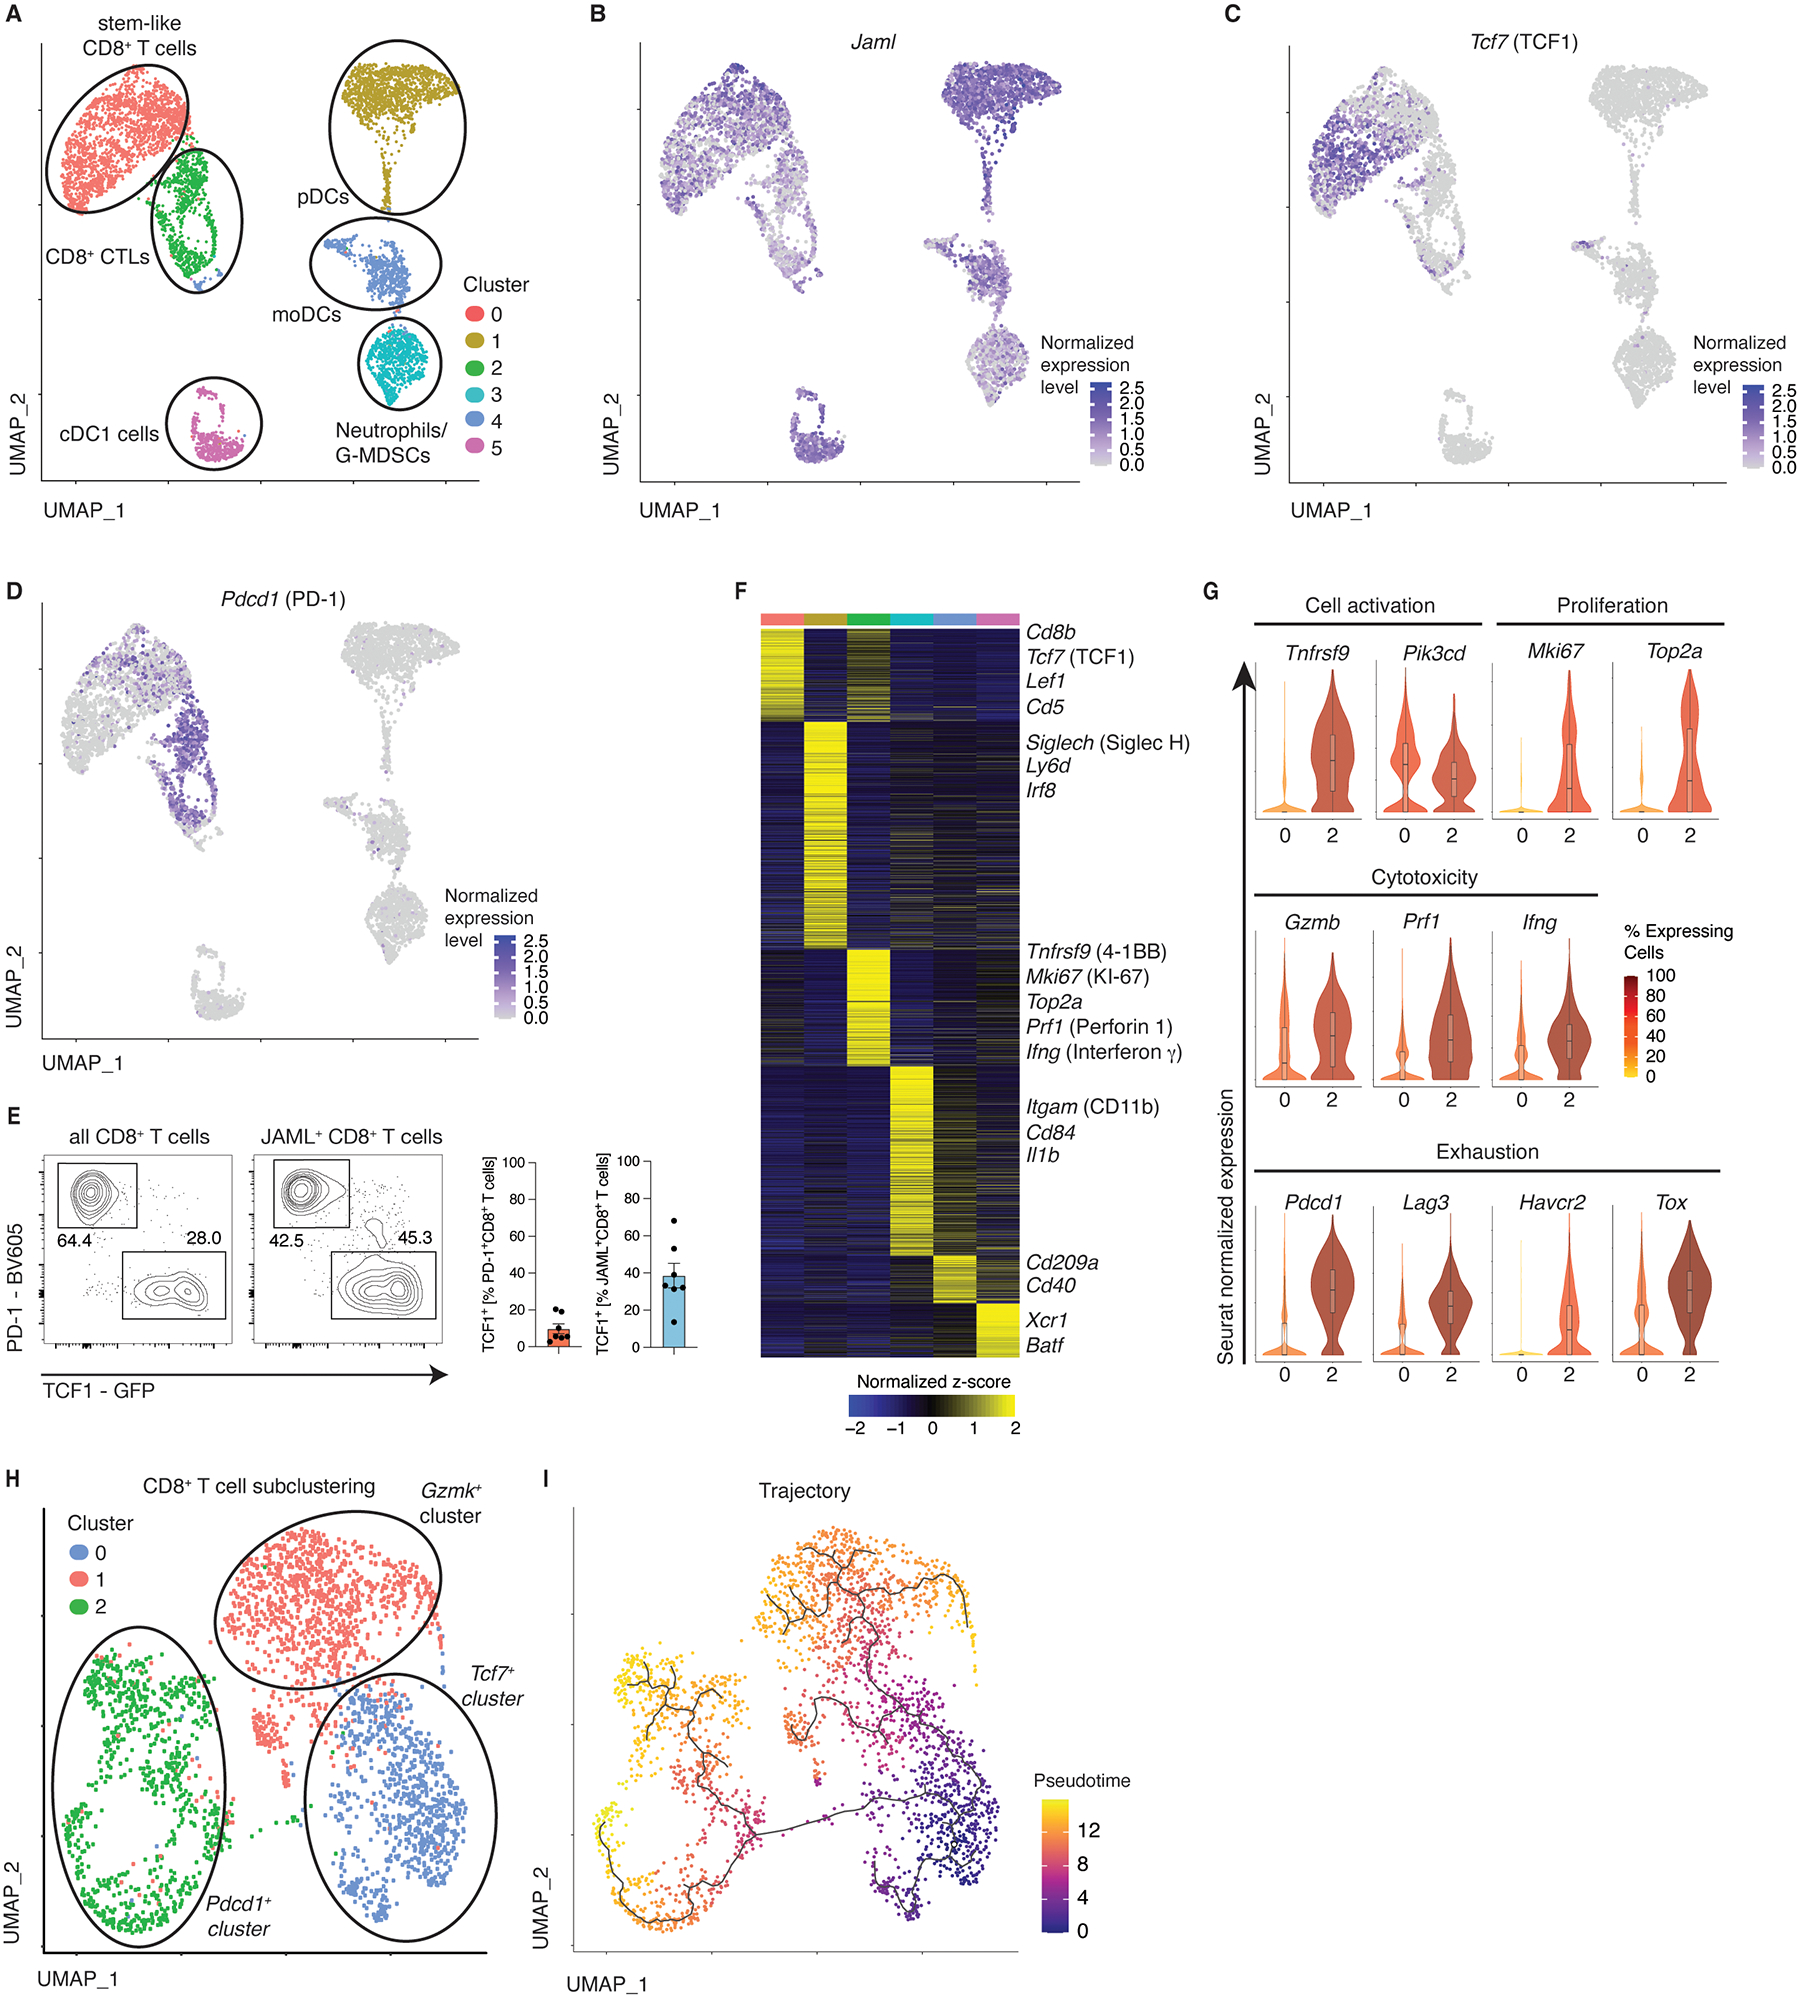
A,B, Analysis of 10x single-cell RNA-seq data visualized by UMAP. Seurat clustering of tumor-infiltrating CD45+JAML+ cells in the B16F10-OVA model at d18 after tumor inoculation (A), B-D, Seurat-normalized expression of Jaml (B), Tcf7 (C) and Pdcd1 (D). E, Flow-cytometric analysis of CD8+ TILs (as in A) expressing the indicated markers. F, Heatmap depicting genes enriched in the identified clusters. Shown are significantly differentially expressed transcripts (Log2 FC>0.25 and adjusted P-value <0.05). G, Violin plots showing Seurat-normalized expression levels of the indicated markers in cells from cluster 0 and cluster 2. H, Sub-clustering of Cd8-expressing TIL subsets from (A). I, Single-cell pseudotime trajectory analysis of the subclustered CD8+ TILs (H) constructed using the Monocle3 algorithm.