
Fig. 7. Anti-JAML synergizes with anti-PD-1 therapy.
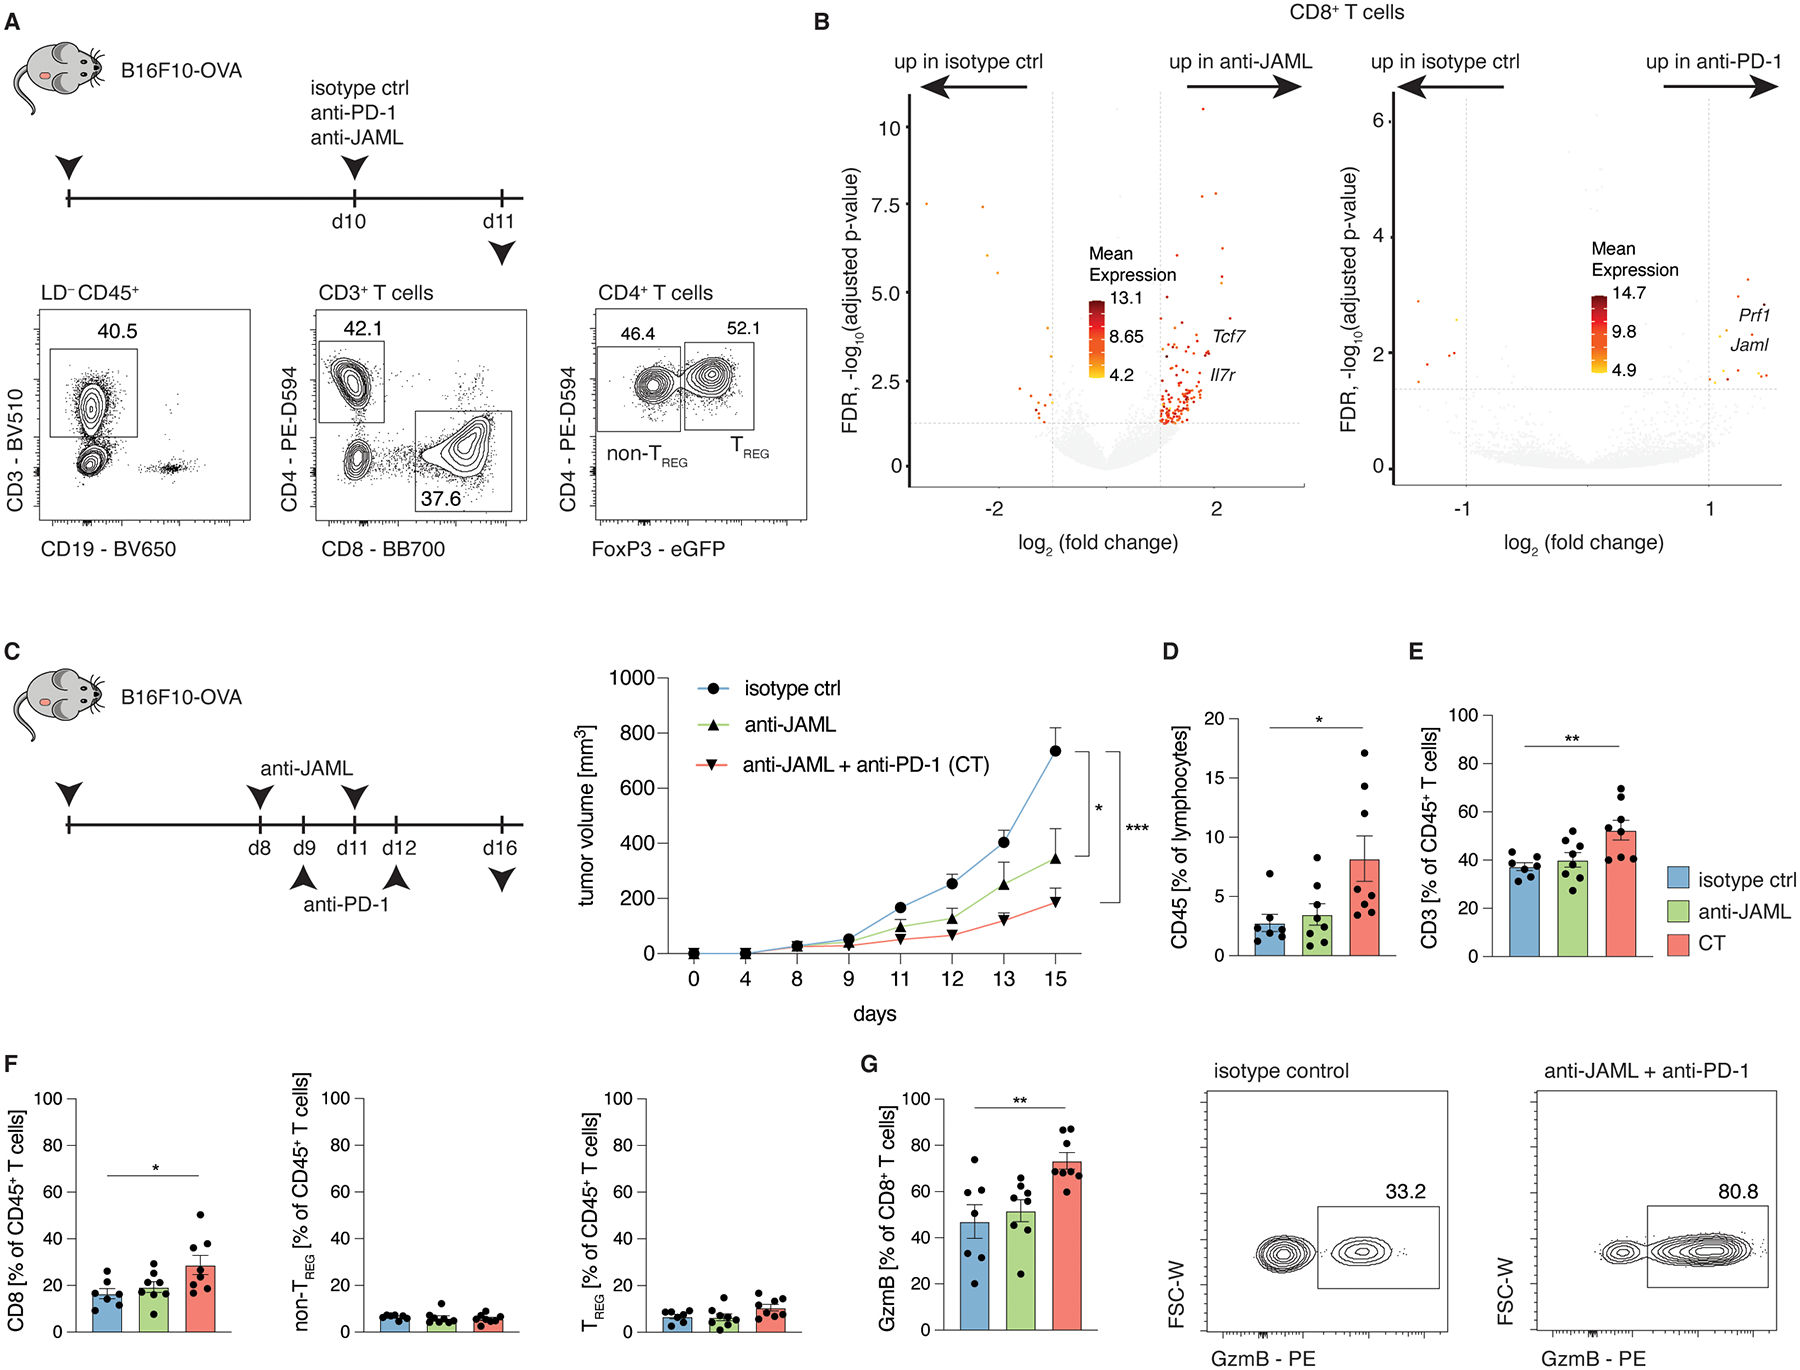
Mice were subcutaneously inoculated with B16F10-OVA cells or MC38-OVA in the right flank and treated with either isotype control antibodies, anti-PD-1 antibodies or anti-JAML antibodies at indicated time points. A, Representative histogram plots depicting the gating strategy for CD4+ TREG cells, CD4+ non-TREG cells and CD8+ T cells. B, Volcano plot of isotype control vs anti-JAML (left) and isotype control vs anti-PD-1 (right) depicting differentially expressed transcripts (Log2 FC>1 and adjusted P-value <0.05). C-G, Tumor volume (C, n=7 mice/group for isotype control, n=8 mice/group for anti-JAML and CT; P=0.0225 for isotype control vs anti-JAML; P=0.0006 for isotype control vs CT), frequencies (D-G; P=0.0192 (D), P=0.0063 (E), P=0.0211 (F), P=0.0044 (G)) and representative contour plots of indicated cell populations of B16F10-OVA tumor-bearing mice treated as indicated as in (C). Data (C-G) are mean +/− S.E.M and are representative of at least 2 independent experiments. Significance for comparisons was computed using one-way ANOVA comparing the mean of each group with the mean of the control group (isotype control) followed by Dunnett’s test; P = 0.1234; *P = 0.0332; **P = 0.0021; ***P = 0.0002; and ****P < 0.0001.