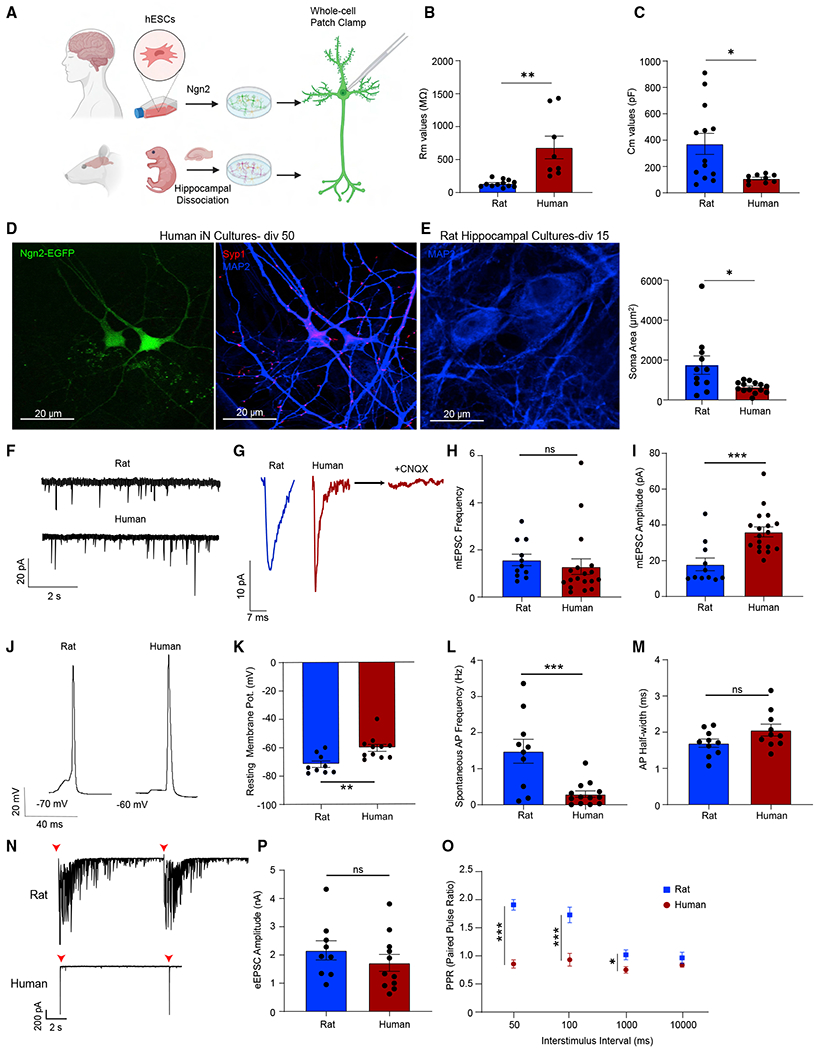
Figure 1. Electrophysiological characterization of human iN cells.

(A) Experimental design for the electrophysiological comparison of human iN and rat hippocampal cultures.
(B and C) Human iN cells have higher membrane resistance (Rm) values and lower capacitance values (Cm) compared with rat hippocampal neurons; dots show individual cells; bars show mean ± SEM; Rm, rat neurons, n = 12; human iN cells, n = 8; N = 2; p = 0.001; unpaired t test; Cm, rat neurons, n = 13; human iN cells, n = 9; N = 2; p = 0.0134; unpaired t test.
(D) Human iN cell immunostaining reveals robust synapse formation (green, Ngn2; blue, MAP2; red, synapsin1). Scale bar, 20 μm.
(E) MAP2 immunostaining reveals that human iN cells are significantly smaller than rat hippocampal neurons. Scale bar, 20 μm. Dots show individual cells; bars show mean ± SEM; rat, n = 11; human, n = 14; N = 2; p = 0.125; unpaired t test.
(F and G) Representative mEPSC traces revealing that iN cells demonstrate sharper miniature events.
(H and I) mEPSC frequency does not differ between human iN cells and rat hippocampal neurons while mEPSC amplitude is significantly higher in iN cells; dots show individual cells; bars show mean ± SEM; mEPSC frequency, rat neurons, n = 11; N = 3; human iN cells, n = 18; N = 3; p = 0.5499; unpaired t test; mEPSC amplitude, rat neurons, n = 11; N = 3; human iN cells, n = 18; N = 3; p = 0.0004; unpaired t test.
(J) Representative APs of human iN cells and rat hippocampal neurons.
(K) iN cell RMP are significantly more depolarized than rat hippocampal neurons; dots show individual cells; bars show mean ± SEM; rat neurons, n = 9; N = 3; human iN cells, n = 11; N = 3; p = 0.0036; unpaired t test.
(L and M) iN cells show lower spontaneous AP frequency compared with rat hippocampal neurons, whereas the AP half-width does not differ; dots show individual cells; bars show mean ± SEM; AP frequency, rat neurons, n = 10, human iN cells, n = 16; N = 3; p = 0.0009; unpaired t test; AP half-width rat neurons, n = 10; N = 3; human iN cells, n = 10; N = 3; p = 0.085; unpaired t test.
(N) Representative traces of eEPSCs of human iN cells and rat hippocampal cells revealing that rat cultures have a profound reverberatory activity upon stimulation.
(O and P) eEPSC amplitudes do not differ between human iN cells and rat hippocampal neurons while the PPRs of rat neurons are significantly higher than human iN cells upon 1, 10, and 20 Hz stimulation; dots show individual cells; bars show mean ± SEM; eEPSC amplitude, rat neurons, n = 9; N = 2; human iN cells, n = 11; N = 3; p = 0.3391; unpaired t test; PPR-50 ms rat n = 8; N = 3; human n = 7; N = 3; p < 0.000001; unpaired t test; PPR-100 ms rat n = 7; N = 3; human n = 9; N = 3; p = 0.000492; unpaired t test; PPR-1,000 ms rat n = 9; N = 3; p = 0.0206; unpaired t test; human n = 10; N = 3; PPR-10,000 ms rat n = 10; N = 3; human n = 11; N = 3; p = 0.234; unpaired t test. Significance are as follows: *p < 0.05, **p < 0.01, ***p < 0.001, ****p < 0.0001; ns, non-significance. See also Figure S1 and Table S1.
