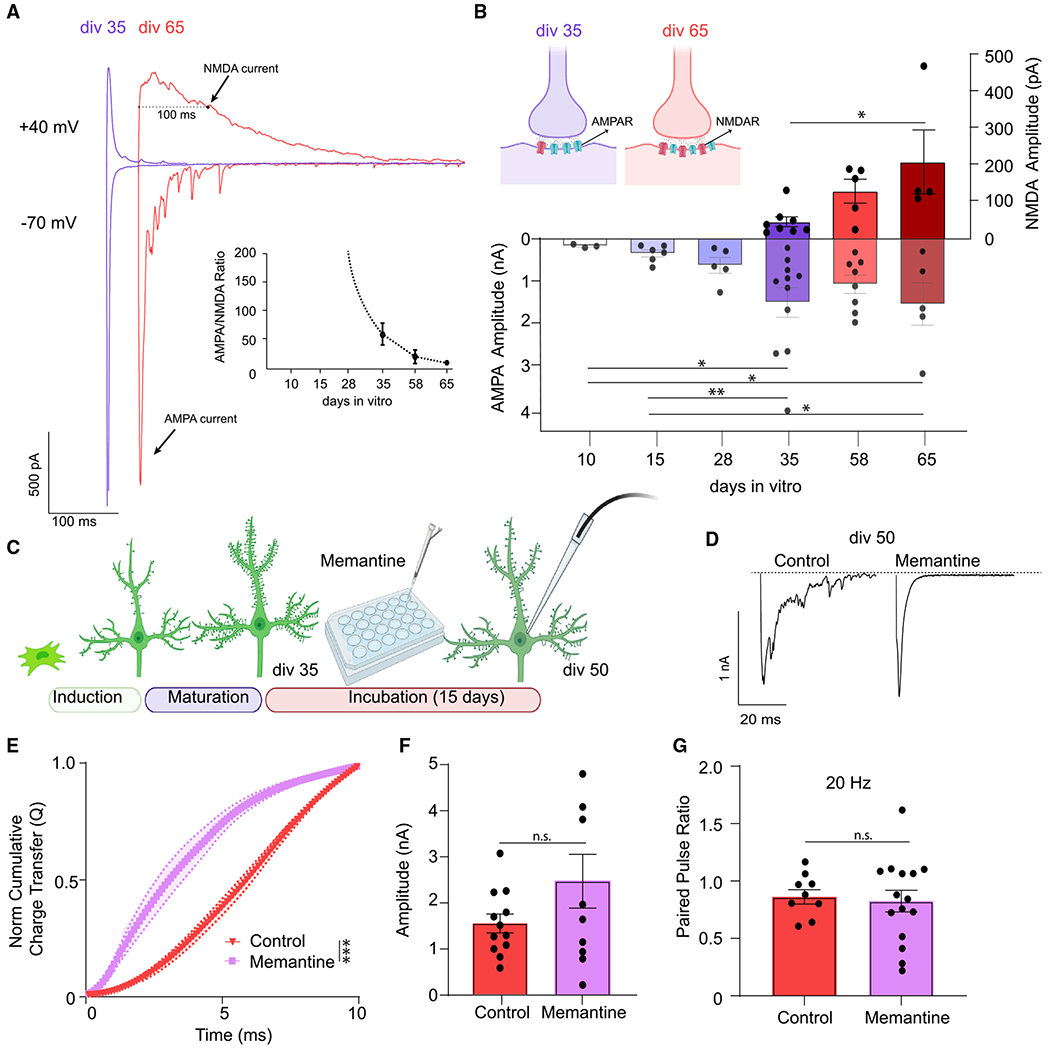
Figure 3. Activation of NMDA receptors mediates the desynchronization of evoked neurotransmitter release.

(A) Evoked AMPA currents (at −70 mV) and NMDA currents (at +40 mV) representative traces from iN cells at div35 and div65.
(B) iN cells develop NMDA currents after div35 that significantly increase to div65 correlating with the desynchronization of evoked neurotransmitter release; dots show individual cells; bars show mean ± SEM; div35(NMDA), n = 8; div58(NMDA), n = 5; div65(NMDA), n = 4; N = 3; p = 0.013 div35 versus div65; one-way ANOVA-Fisher’s LSD; div10(AMPA), n = 3; div15(AMPA), n = 6; div28(AMPA), n = 5; div35(AMPA), n = 11; div58(AMPA), n = 8; div65(AMPA), n = 5; N = 3; p = 0.019 div10 versus div35; p = 0.03 div10 versus div65; p = 0.01 div15 versus div35; p = 0.023 div15 versus div65; one-way ANOVA-Fisher’s LSD.
(C) Experimental design for chronic (15 days) 10 μM memantine treatment of div50 iN cells.
(D) eEPSC representative traces following chronic 10 μM memantine treatment versus control at div50.
(E) The NCCT(Q) of eEPSCs following memantine treatment versus controls at div50 reveals that memantine treatment makes evoked release significantly more synchronous; bars show mean ± SEM; control, n = 12; memantine, n = 10; N = 2; p < 0.001; simple linear regression; p < 0.0001; Kolmogorov-Smirnov test.
(F and G) The PPR or the eEPSC div50 amplitudes do not change following chronic 10 μM memantine treatment; dots show individual cells; bars show mean ± SEM; eEPSC amplitude, control, n = 12; memantine, n = 10; N = 2; p = 0.127; unpaired t test; PPR, control, n = 9; memantine, n = 15; N = 2; p = 0.783; unpaired t test. Significance levels are as follows: *p < 0.05, **p < 0.01, ***p < 0.001, ****p < 0.0001; ns, non-significance. See also Figure S3 and Table S1.
