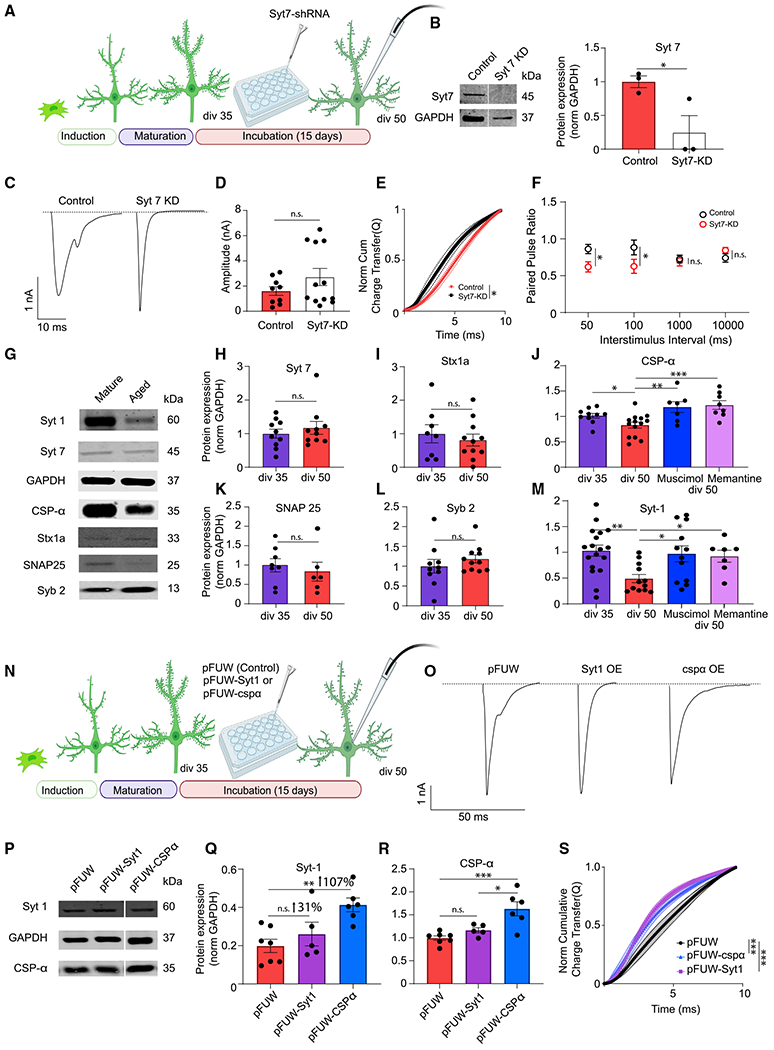
Figure 5. The molecular mechanisms underlying desynchronized neurotransmitter release.

(A) Experimental design for iN Syt-7 knockdown (KD) experiment.
(B) Representative western blots and Syt-7 protein levels in iN cell lysates transduced with control or Syt-7-KD lentivirus; dots show individual coverslips; bars show mean ± SEM; control, n = 3; Syt-7-KD, n = 3; N = 2; p = 0.04; unpaired t test.
(C) Representative traces of control or Syt-7-KD eEPSCs at div50.
(D) eEPSC amplitude does not change significantly following Syt-7-KD; dots show individual cells; bars show mean ± SEM; control, n = 9; Syt-7-KD, n = 12; N = 2; p = 0.201; unpaired t test.
(E) The NCCT of eEPSC following Syt-7-KD shows synchronization of evoked release suggesting that Syt-7 acts as the calcium sensor in asynchronous release at div50; bars show mean ± SEM; control, n = 7; Syt-7-KD, n = 12; N = 2; p = 0.03; simple linear regression; p < 0.0001, Kolmogorov-Smirnov test.
(F) Syt-7-KD does not affect the PPR at low-frequency stimulation (0.1–1 Hz) but significantly decreases the PPR at high-frequency stimulation (10–20 Hz); bars show mean ± SEM; 50 ms-control, n = 9; Syt-7-KD, n = 5; N = 2; p = 0.04; unpaired t test; 100 ms-control, n = 10; Syt-7-KD, n = 5; N = 2; p = 0.02; unpaired t test; 1,000 ms-control, n = 11; Syt-7-KD, n = 5; N = 2; p = 0.846; unpaired t test; 10,000 ms-control, n = 12; Syt-7-KD, n = 6; N = 2; p = 0.32; unpaired t test.
(G, H, I, K, and L) Representative western blots and Syt-7, syntaxin-1a, SNAP25, and synaptobrevin-2 protein levels in iN cell lysates at div35 and div50; dots show coverslips; bars show mean ± SEM; Syt-7, div35, n = 10; div50, n = 6; N = 3; p = 0.447; unpaired t test; syntaxin-1a, div5, n = 8; div50, n = 11; N = 3; p = 0.5519; unpaired t test; SNAP25, div35, n = 8; div50, n = 6; N = 3; p = 0.557; unpaired t test; Syb2, div35, n = 10; div50, n = 11; N = 3; p = 0.356; unpaired t test.
(J–M) Western blot quantification reveals a decrease of Syt-1 and CSPα at div50 compared with div35. The decrease in both CSPα and Syt-1 were rescued by memantine or muscimol treatment; dots show coverslips; bars show mean ± SEM; Syt-1; div35, n = 15; div50, n = 12; div50 + muscimol, n = 12; div50 + memantine, n = 7; N = 3; p = 0.002, div35 versus div50; unpaired t test; p = 0.024, div50 versus div50 + muscimol; p = 0.041, div50 versus div50 + memantine; one-way ANOVA-Fisher’s LSD; CSPα, div35, n = 10; div50, n = 14; div50 + muscimol, n = 7; div50 + memantine, n = 8; N = 3; p = 0.03, div35 versus div50; unpaired t test; p = 0.001, div50 versus div50 + muscimol; p < 0.001, div50 versus div50 + memantine; one-way ANOVA-Fisher’s LSD.
(N) Experimental design for Syt-1, CSPα rescue experiments.
(O) Representative traces of eEPSC at div50 following infection with control (pFUW) virus, Syt-1-expressing virus, or CSPα-expressing virus.
(P–R) Representative western blots and Syt-1 and CSPα protein levels in iN cell lysates at div50 following infection with control virus, Syt-1-expressing virus, or CSPα-expressing virus; dots show coverslips; bars show mean ± SEM; Syt-1, pFUW, n = 7; pFUW-Syt-1, n = 5; pFUW-CSPα, n = 6; N = 3; p = 0.329, pFUW versus pFUW-Syt-1; p = 0.002, pFUW versus pFUW-CSPα; p = 0.03, pFUW-CSPα versus pFUW-Syt-1; one-way ANOVA-Fisher’s LSD; CSPα, pFUW, n = 7; pFUW-Syt-1, n = 5; pFUW-CSPα, n = 6; N = 3; p = 0.729, pFUW versus pFUW-Syt-1; p < 0.001, pFUW versus pFUW-CSPα; p = 0.018, pFUW-CSPα versus pFUW-Syt-1; one-way ANOVA-Fisher’s LSD.
(S) The NCCT of eEPSCs at div50 following infection with Syt-1 or CSPα rescue vectors show that increased expression of either Syt-1 or CSPα make evoked release more synchronous; bars show mean ± SEM; pFUW, n = 12; pFUW-Syt-1, n = 12; pFUW-CSPα, n = 11; N = 2; p < 0.01 for both pFUW versus pFUW-Syt-1 and pFUW versus pFUW-CSPα; simple linear regression; p < 0.0001 for both pFUW versus pFUW-Syt-1 and pFUW versus pFUW-CSPα, Kolmogorov-Smirnov test. When the representative bands in the figures belong to different membranes or different lanes on the same membrane, they are separated by a blank space. When they are in the neighboring lanes, they are presented without a blank space. Significance levels are as follows: *p < 0.05, **p < 0.01, ***p < 0.001, ****p < 0.0001; ns, non-significance. See also Table S1.
