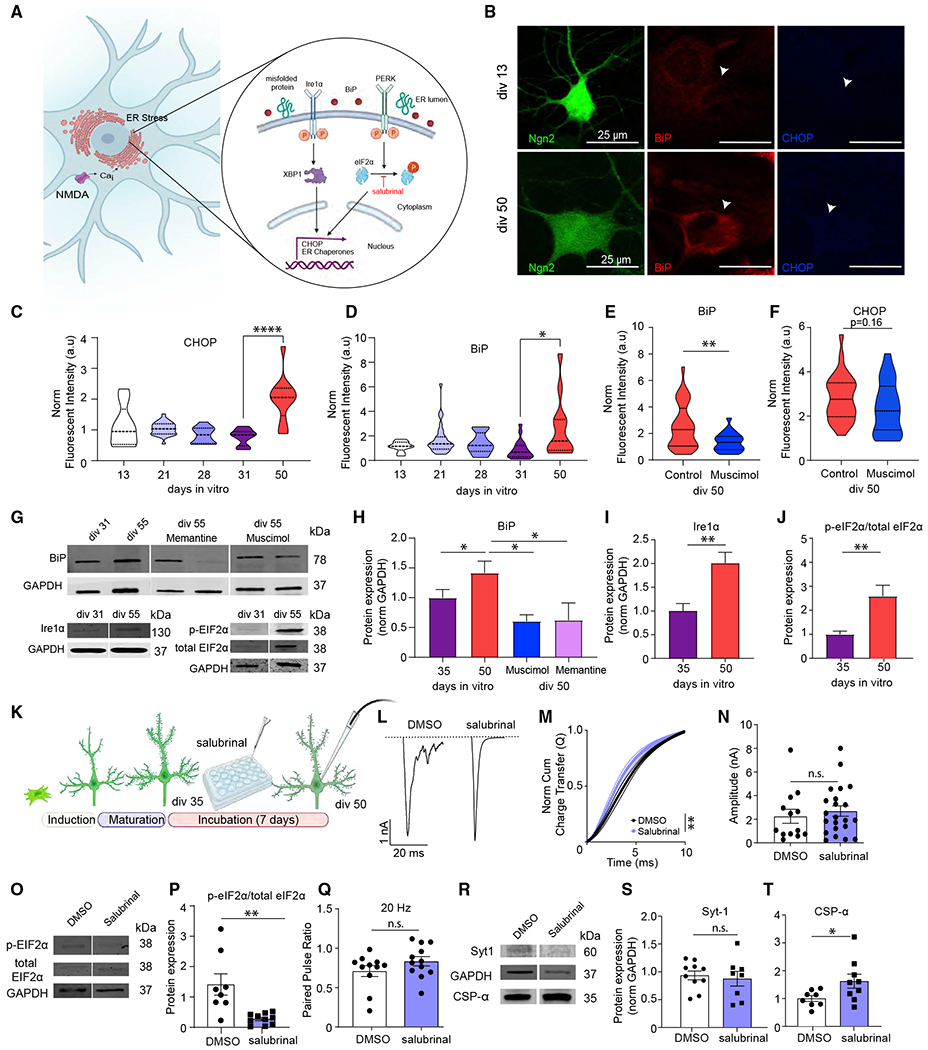
Figure 6. The role of ER stress response in the desynchronization of evoked neurotransmitter release.

(A) Schematic image outlining the endoplasmic reticulum (ER) stress response.
(B) Representative images of immunofluorescent staining of iN cells at div13 and div50 against ER stress markers BiP and CHOP (green, Ngn2; red, BiP; blue, CHOP). Scale bar, 20 μm.
(C and D) Fluorescent intensity of BiP and CHOP immunofluorescent signal throughout maturation from div13 to div50 reveals increased ER stress markers at div50; bars show mean ± SEM; CHOP, div3, n = 9; div21, n = 28; div28, n = 13; div31, n = 19; div0, n = 12; N = 2; p < 0.0001, div31 versus div50; one-way ANOVA-Tukey’s multiple comparison test; BiP, div13, n = 9; div21,n = 28; div28, n = 13; div31, n = 19; div50, n = 12; N = 2; p = 0.03, div31 versus div50; one-way ANOVA-Tukey’s multiple comparison test.
(E and F) Fluorescence intensity of BiP and CHOP immunofluorescent signal at div50 upon chronic (15 days) muscimol treatment reveals significantly decreased BiP fluorescence intensity and a decreasing trend for CHOP fluorescence intensity; bars show mean ± SEM; BiP, div50 control, n = 29; div50 muscimol, n = 22; N = 2; p = 0.0056; Mann-Whitney U test; CHOP, div50 control, n = 29; div50 muscimol, n = 24; N = 2; p = 0.16; Mann-Whitney U test.
(G–J) Representative western blots, BiP and Ire1 α protein levels, and eIF2α phosphorylation at div31 and div55; bars show mean ± SEM; BiP, div35, n = 10; div50, n = 9; div50 + muscimol, n = 4; div50 + memantine, n = 3; N = 2; p = 0.04, div35 versus div50; p = 0.01, div50 versus div50 + muscimol; p = 0.02, div50 versus div50 + memantine; one-way ANOVA-Fisher’s LSD; Ire1α, div35, n = 10; div50, n = 13; N = 2; p = 0.003; unpaired t test; eIF2α phosphorylation, div35, n = 8; div50, n = 9; N = 2; p = 0.0048; unpaired t test.
(K) Experimental design for iN cell treatment with the ER stress inhibitor salubrinal.
(L) eEPSC representative traces following 7–10 day incubation with either DMSO, or salubrinal.
(M) The NCCT of eEPSCs following 7–10 day incubation with DMSO or salubrinal reveals that salubrinal makes evoked neurotransmitter release significantly more synchronous; bars show mean ± SEM; DMSO, n = 13; salubrinal, n = 12; N = 3; p = 0.003; simple linear regression; p < 0.0001, Kolmogorov-Smirnov test.
(N and Q) The amplitude and PPR (20 Hz) does not change upon incubation with salubrinal treatment; dots show individual cells; bars show mean ± SEM; eEPSC amplitude, DMSO, n = 13; salubrinal, n = 22; N = 2; p = 0.55; unpaired t test; PPR, DMSO, n = 11; salubrinal, n = 12; N = 2; p = 0.18; unpaired t test.
(O and P) Representative western blots and quantification reveal that eIF2α phosphorylation is decreased upon 7-to 10-day-long incubation with salubrinal; dots show individual coverslips; bars show mean ± SEM; eIF2α phosphorylation, DMSO, n = 8; salubrinal, n = 10; N = 2; p = 0.0014; Mann-Whitney U test.
(R–T) Representative western blots and Syt-1 and CSPα quantification reveal that salubrinal treatment does not change Syt-1, whereas it increases CSPα expression; dots show coverslips; bars show mean ± SEM; Syt-1, DMSO n = 10, salubrinal n = 8; N = 2; p = 0.6938; unpaired t test. CSPα, DMSO n = 8, salubrinal n = 9; N = 2; p = 0.045; unpaired t test. When the representative bands in the figures belong to different membranes or different lanes on the same membrane, they are separated by a blank space. When they are in the neighboring lanes, they are presented without a blank space. Significance levels are as follows: *p < 0.05, **p < 0.01, ***p < 0.001, ****p < 0.0001; ns, non-significance. See also Table S1.
