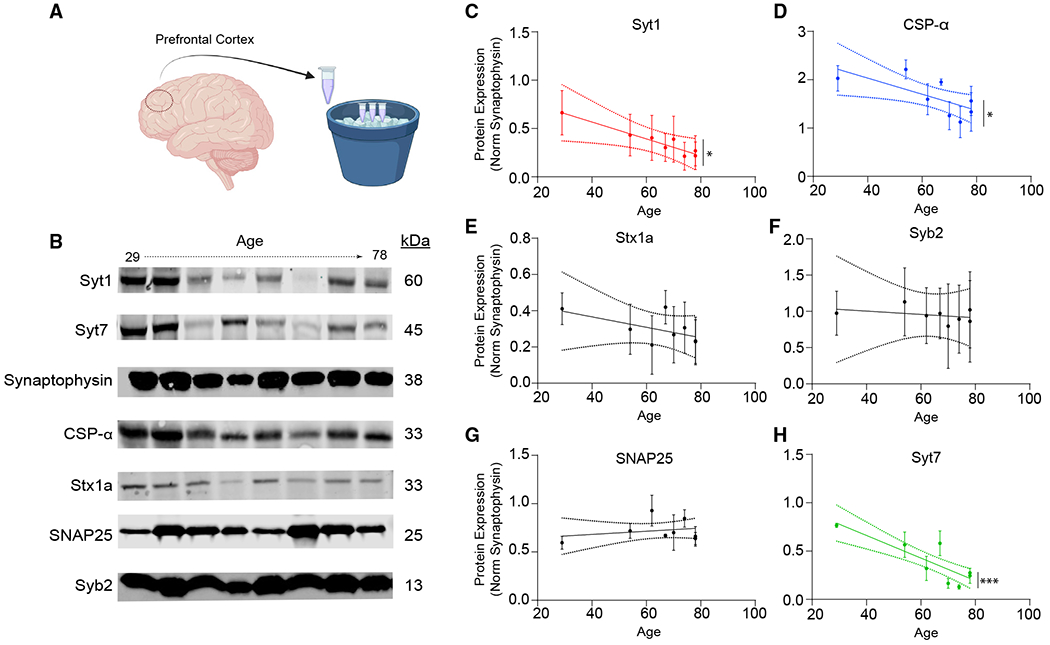
Figure 7. Age-related changes in the presynaptic machinery translates to postmortem human cortex.

(A and B) The experimental design and representative western blots showing SNARE protein levels in postmortem human cortex as a function of age.
(C, D, and H) Syt-1, CSPα, and Syt-7 levels reveal that these proteins significantly decrease with age; bars show mean ± SEM; n = 8; experiments were replicated using three distinct cortical samples from the same subjects; N = 3; p = 0.027 (Syt-1); p = 0.022 (CSPα); p < 0.001 (Syt-7); simple linear regression.
(E–G) Stx1a, Syb2, and SNAP25 quantification reveals no change in expression with age; bars show mean ± SEM; n = 8; experiments were replicated using three distinct cortical samples from the same subjects; N = 3; p = 0.302 (Stx1a); p = 0.806 (Syb2); p = 0.497 (SNAP25); simple linear regression. When the representative bands in the figures belong to different membranes or different lanes on the same membrane, they are separated by a blank space. When they are in the neighboring lanes, they are presented without a blank space. Significance levels are as follows: *p < 0.05, **p < 0.01, ***p < 0.001, ****p < 0.0001; ns, non-significance. See also Figure S4 and Table S1.
