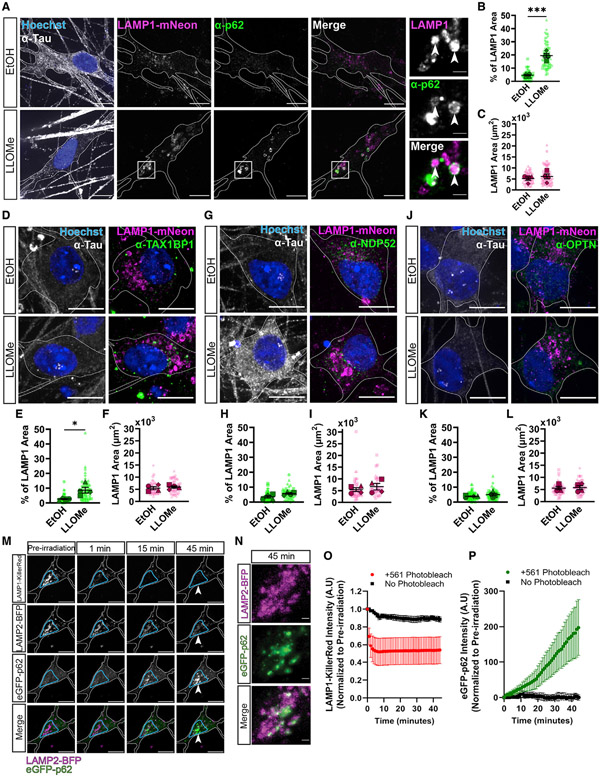
Figure 2. p62 responds to lysosomal damage in human and rat neurons.
(A) Representative max projections of α-p62 and LAMP1-mNeonGreen in human iPSC-derived neurons (i3Neurons), which were treated with EtOH or 1.0 mM LLOMe for 2 h. Cell outlines are traced. White boxes indicate inset image region. Arrowheads indicate areas of co-localization. Inset images are single z-plane images. SBs: 10 αm; insets: 2 αm.
(B) Quantification of the overlapping area from max projections between α-p62 and LAMP1-mNeonGreen in cells treated with EtOH or with LLOMe (unpaired t test, p < 0.001, n = 4 experiments. Number of cells analyzed per condition ≥ 54).
(C) Quantification of LAMP1 area from max projections in the different conditions (unpaired t test, p = 0.5047, n = 4 experiments. Number of cells analyzed per condition ≥ 54).
(D) Representative max projections of images comparing α-TAX1BP1 localization with lysosomes in i3Neurons following treatment with either EtOH or 1.0 mM LLOMe for 2 h. Cell outlines were traced. SBs: 10 αm.
(E) Quantification of the percentage of LAMP1 area occupied by α-TAX1BP1in cells treated with EtOH or with LLOMe (unpaired t test, p < 0.05, n = 4 experiments. Number of cells analyzed per condition ≥ 45).
(F) Quantification of LAMP1 area from max projections in the different conditions (unpaired t test, p = 0.6003, n = 4 experiments. Number of cells analyzed per condition ≥ 45).
(G) Representative max projections of images comparing α-NDP52 localization with lysosomes in i3Neurons following treatment with either EtOH or 1.0 mM LLOMe for 2 h. Cell outlines were traced. SBs: 10 μm.
(H) Quantification of the percentage of LAMP1 area occupied by α-NDP52 in cells treated with EtOH or with LLOMe (unpaired t test, p = 0.0708, n = 4 experiments. Number of cells analyzed per condition ≥ 45).
(I) Quantification of LAMP1 area from max projections in the different conditions (unpaired t test, p = 0.4643, n = 4 experiments. Number of cells analyzed per condition ≥ 45).
(J) Representative images max projections comparing α-OPTN localization with lysosomes in i3Neurons following treatment with either EtOH or 1.0 mM LLOMe for 2 h. Cell outlines were traced. SBs: 10 μm.
(K) Quantification of the percentage of LAMP1 area occupied by α-OPTN in cells treated with EtOH or with LLOMe (unpaired t test, p = 0.2476, n = 4 experiments). Number of cells analyzed per condition ≥ 50).
(L) Quantification of LAMP1 area from max projections in the different conditions (unpaired t test, p = 0.8482, n = 4 experiments. Number of cells analyzed per condition ≥ 50).
(M) Representative images of rat hippocampal neurons transiently transfected with LAMP1-KillerRed, LAMP2-BFP, and EGFP-p62. Cell outlines are traced. Blue boxes reflect regions irradiated. Arrowheads reflect location of inset images in Figure 1N. SBs: 10 μm.
(N) Inset images of LAMP2-BFP and EGFP-p62 from Figure 1M of rat hippocampal neurons following 45-min post-laser activation. SBs: 2 μm.
(O) Quantification of LAMP1-KillerRed intensities within irradiated or untreated regions.
(P) Quantification of EGFP-p62 intensities within irradiated or untreated regions.
All error bars reflect mean ± SEM. See also Video S2.

