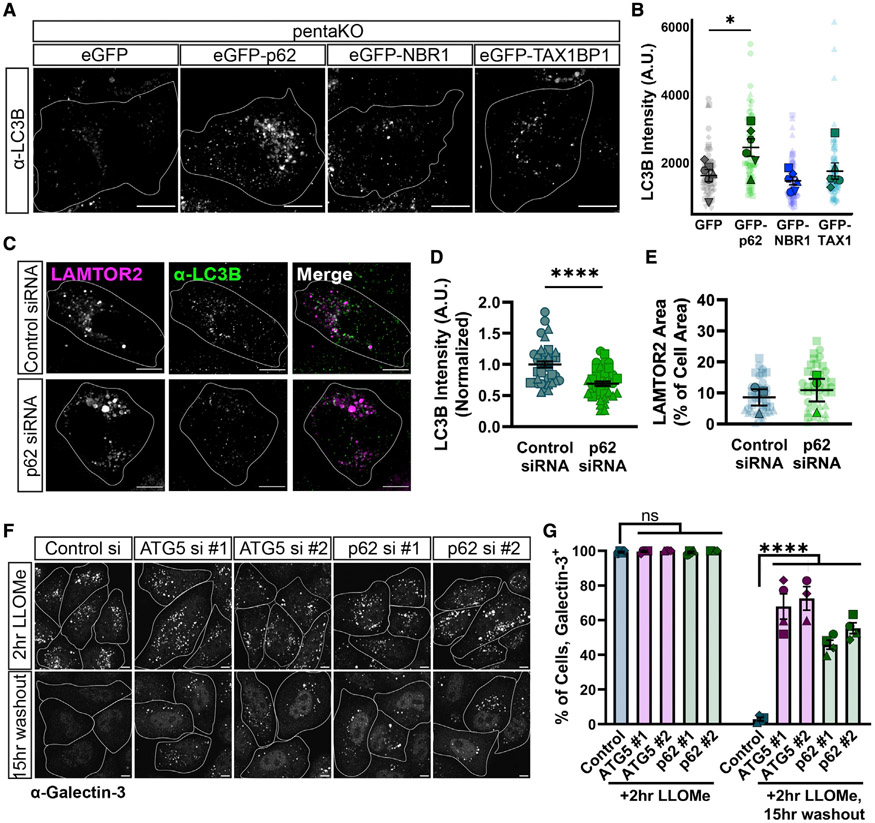
Figure 3. p62 is necessary and sufficient for lysophagy.
(A) Representative max projections of α-LC3B in pentaKO HeLa cells. Cells were treated with 750 μM LLOMe for 2 h. Cells were transfected with mCherry-LAMTOR2 and either GFP vector, EGFP-p62, EGFP-NBR1, or EGFP-TAX1BP1; endogenous LC3B was visualized by immunostaining. Cell outlines are traced. SBs: 10 μm.
(B) Quantification of α-LC3B intensity at LAMTOR2 puncta across different conditions (one-way ANOVA, p(GFP/p62) < 0.05, p(GFP/NBR1) = 0.9042, p(GFP/TAX1) = 0.9417, n = 6 experiments, Number of cells analyzed per condition ≥ 64).
(C) Representative max projections of mCherry-LAMTOR2 and α-LC3B in HeLa cells, which were transiently transfected with control siRNA or p62 siRNA (#1) alongside mCherry-LAMTOR2. HeLa cells were treated with 750 μM LLOMe for 2 h. Cell outlines are traced. SBs: 10 μm.
(D) Quantification of normalized α-LC3B intensity at LAMTOR2 puncta across different conditions (Mann-Whitney U test, p < 0.0001, n ≥ 40 cells per condition).
(E) Quantification of mCherry-LAMTOR2 area across different conditions (unpaired t test, p = 0.6338, n = 3 experiments. Number of cells analyzed per condition ≥ 40).
(F) Representative max projections of endogenous galectin-3 flux assay. Cells were fixed immediately following LLOMe treatment or 15 h post-washout of LLOMe. Cells were transiently transfected with one of two ATG5 siRNAs, one of two p62 siRNAs, or a control siRNA. Cell outlines are traced. SBs: 10 μm.
(G) Quantification of the galectin-3 flux assay, indicating the fraction of cells with n > 3 galectin-3 puncta per cell (one-way ANOVA, post-LLOMe: p(control/ATG5#1) > 0.9999, p(control/ATG5#2) > 0.9999, p(control/p62#1) > 0.9999, p(control/p62#2) > 0.9999; post-washout: p(control/ATG5#1) < 0.0001, p(control/ATG5#2) < 0.0001, p(control/p62#1) < 0.0001, p(control/p62#2) < 0.0001, p(ATG5 #1/ATG5#2) = 0.9983, p(p62 #1/p62#2) = 0.5105; n = 3 or 4 experiments).
All error bars reflect mean ± SEM. See also Figures S1, S2 and S3.

