
FIGURE 3.
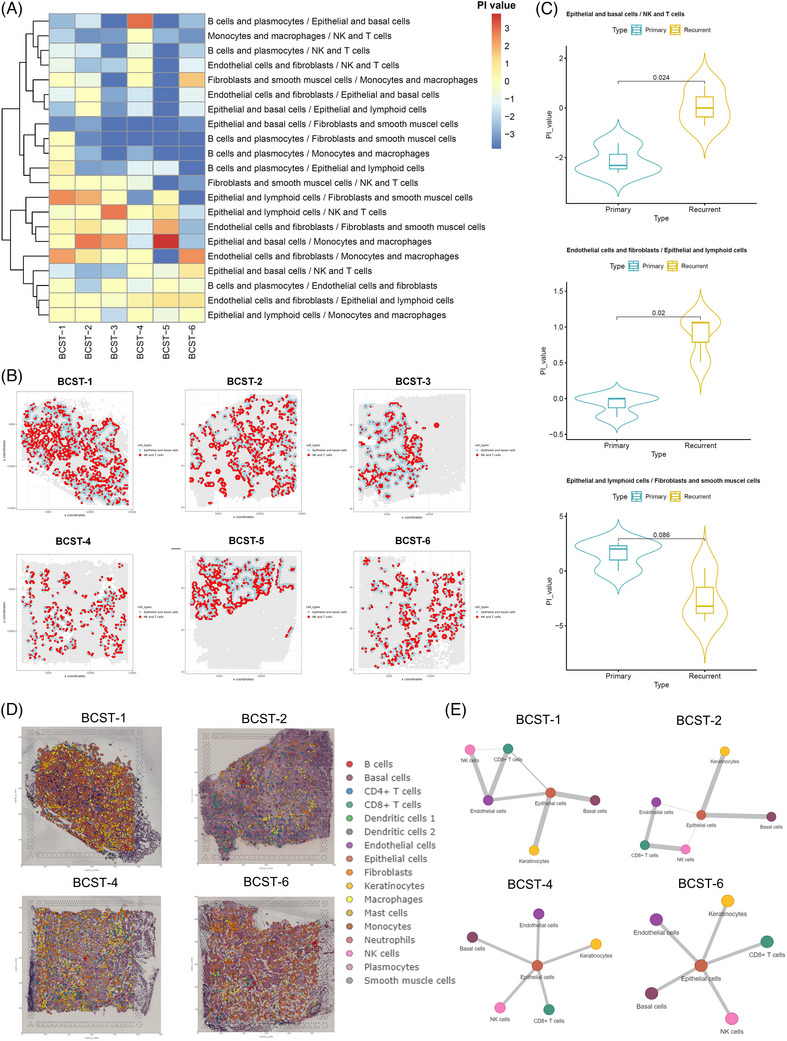
Cell–cell proximate comparison between primary and recurrent bladder tumour. (A) Heatmap of cell–cell proximity enrichment score of seven spot clusters among six samples. The PI value was defined as log2 fold change (FC) × –log10 (adjusted p‐value), simulated by Giotto cellProximityEnrichment function. (B) Violin plot of the PI value between the pair of epithelial and basal cells/natural killer (NK) cells and T cells, endothelial cells and fibroblasts/epithelial and lymphoid cells, epithelial and lymphoid cells/fibroblasts, and smooth muscle cells. (C) Cell–cell proximity visualisation of C0: NK and T cells and C1: epithelial and basal cells, all six patients NK, T cell and epithelial basal cell–cell were labelled by red and blue colour, plotted by Giotto cellProximitySpatPlot2D function. (D) Co‐embedding analysis of single‐cell and spatial transcriptomes by CellTrek. (E) Spatial colocalisation analysis of NK cells, T cells and epithelial cells by Delaunay triangulation approach. BCST 1 and 2: primary, 4 and 6: recurrent.