
FIGURE 4.
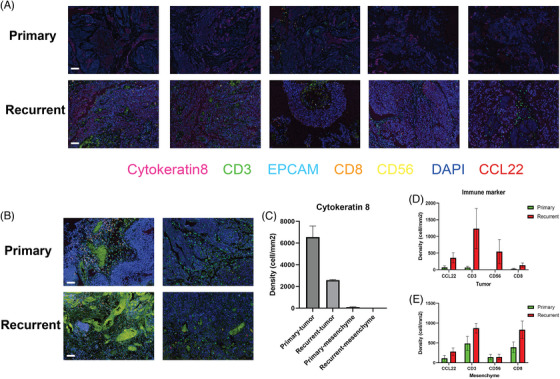
Validation of increased natural killer (NK)/T and epithelial/basal cell–cell interactions by multiplex immunofluorescence experiments. (A) Featured scanned slides of tumour regions of primary and recurrent tumours. Each slide corresponds to tissue samples from a distinct individual. N = 5. The indicated colours represent different markers. Bar = 50 μm. (B) Featured scanned slides of mesenchyme of primary and recurrent tumours. (C) Density quantification of cytokeratin‐8 for determining tumour and mesenchyme regions. The Akoya Vectra Polaris Automated Quantitative Pathology Imaging System was used to scan the slides, and Akoya Inform software was used to quantify the results. N = 5. (D and E) Quantification results of NK/T‐cell population in the tumour and mesenchyme regions.