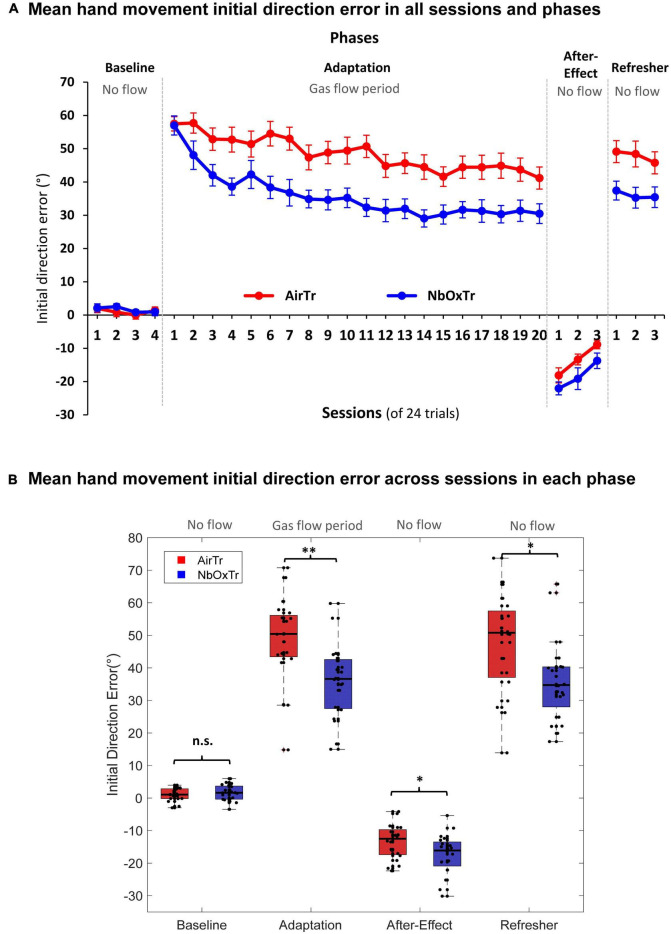
FIGURE 2.
The oxygen treatment improves crucial motor learning characteristics linked to movement planning. (A) Mean IDE in each experiment phase and across sessions for both groups, NbOxTr and AirTR. (B) Mean IDE across each experiment phase (Baseline, Adaptation, After-Effect, Refresher) for both groups, NbOxTr and AirTR. n.s., non-significant, *P < 0.05, **P < 0.01. Boxes represent the 25 to 75 percentile and whiskers represent 2.7 times of standard deviation. Black dots represent individual data points. Plots for Adaptation, After-Effect, and Refresher in panel (B) are based on normalized data subtracted from the mean Baseline for any given participant and session.

