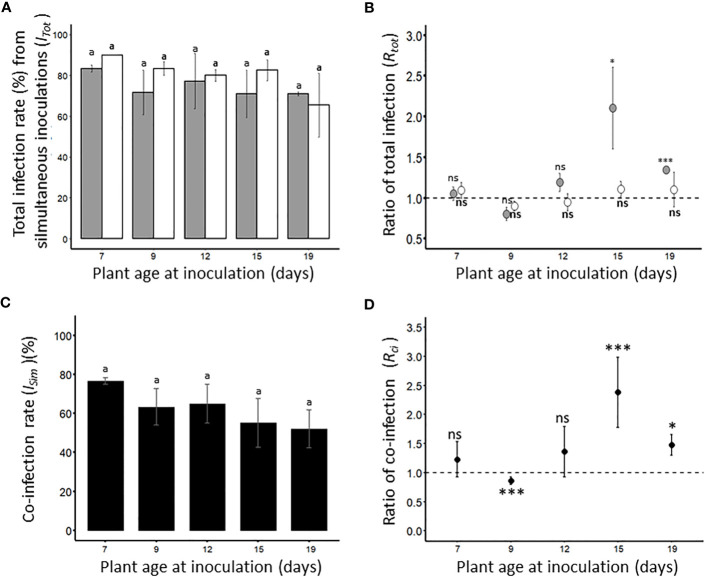
Figure 4.
Total infection rate of viruses (A, B) and occurrence of co-infections (C, D) after simultaneous inoculations of BYDV-PAV and WDV. Seven-days old wheat plants were simultaneously inoculated (2 viruliferous R. padi and 2 viruliferous P. alienus for 24 h IAP) with BYDV-PAV and WDV. Twenty-one days after inoculation, the sanitary status of each plant was tested by DAS-ELISA against the two viruses. Experiments were carried out with series of 20 plants/virus species/DAI and repeated three times. For each virus species/plant age at inoculation combination, the total infection rate of BYDV-PAV (in grey) and WDV (in white) was calculated (A). Then, these data were normalized by infection rates obtained after the singly inoculation of each virus (see. Figure 1 ) to calculate the ratio of total infection (Rtot ) (B). Co-infection rate (ISim , in black) was calculated for each virus species/plant age combination (C) and divided by the theoretical co-infection rate to obtain the ratio of co-infection (Rci ) (D). Histogram bars (A, C) and points (B, D) represent the mean of monitored values. Errors bars represent the standard errors. Letters (i.e. a) and asterisks (ns: non significant, *: P≤ 0.05, **: P≤ 0.01, ***: P≤ 0.001) were obtained after statistical analysis (GLM (family binomial) followed by EMM post-hoc test (A, C), or χ² test (D)) of raw data. For a virus species (in bold for WDV), these symbols illustrate a significant/non-significant difference (α = 0.05) between i) plant age (A, C), ii) the type of inoculation (i.e. single versus simultaneous inoculation) (B) or iii) observed and theoretical co-infection rates (D).

