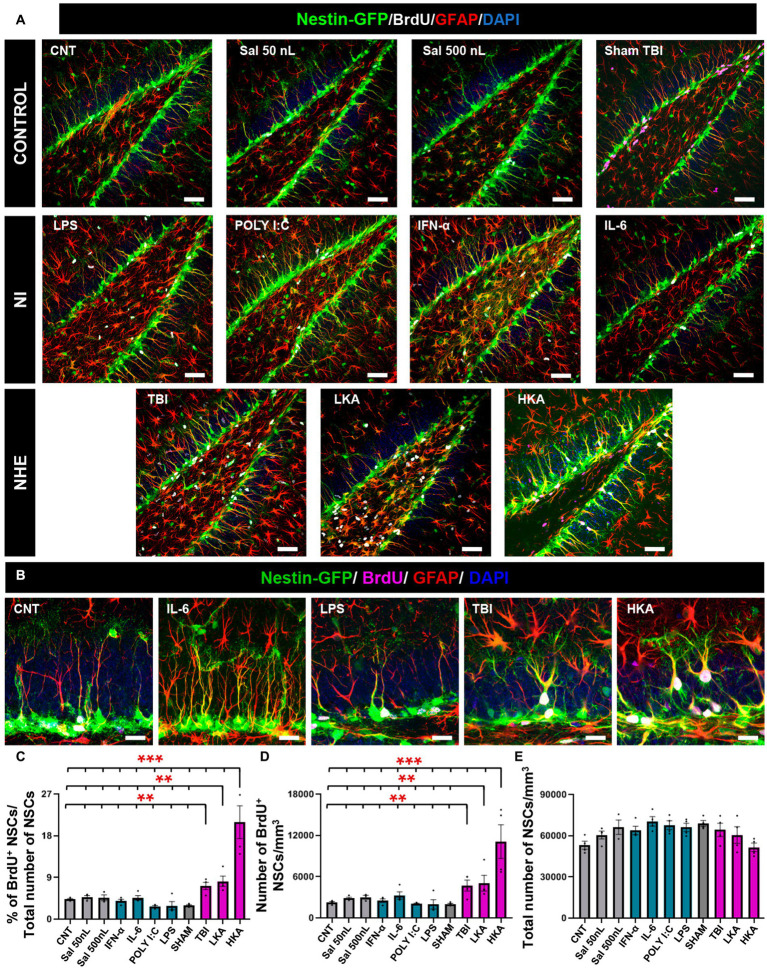
Figure 1.
NHE but not NI induces NSCs hyperproliferation. (A) Confocal microscopy images showing the dentate gyrus of control, NI and NHE Nestin-GFP mice at 3 days after the procedure. Brain slices were immunostained for GFP, GFAP and BrdU. DAPI was used to stain cell nuclei. (B) Higher magnification images corresponding to representative models of NI and NHE. (C) Proportion of dividing NSCs among the total population of NSCs. (D) Density of BrdU+NSCs. (E) Total number of NSCs. The scale bar is 50 μm in (A) and 15 μm in (B). *p < 0.05, **p < 0.01, ***p < 0.001. One-way ANOVA after all pairwise multiple comparisons by Holm-Sidak post hoc test. Bars show mean ± SEM. Dots show individual data.

