Figure 2.
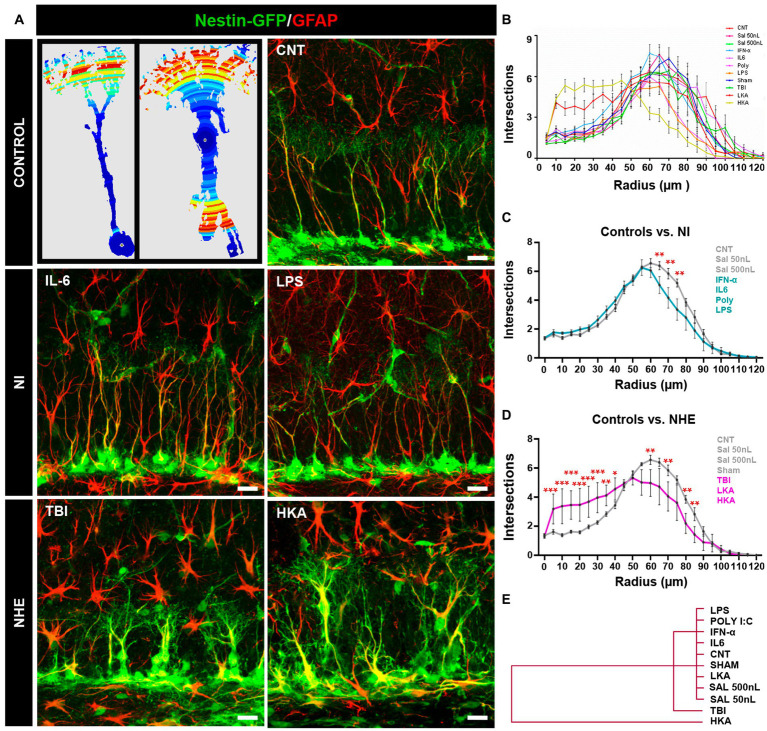
NHE but not NI induces morphological changes in NSCs. (A) The left panel shows examples of images originating from confocal microscopy-based z-stack projections of GFAP+Nestin-GFP+ NSCs and rendered after 3D-Sholl analysis. The color indicates the number of intersections in each radius (blue fewer and red, higher). The rest of the panels show confocal microscopy images showing NSCs in the SGZ at 3 days after the procedures. (B) Quantification of the morphological complexity of the NSCs based on the 3D-sholl analysis (number of intersections between the cell and virtual spheres of increasing radius). (C) Quantification of the morphological complexity of the NSCs pooling the NI models vs. controls. (D) Quantification of the morphological complexity of the NSCs pooling together the NHE models vs. the controls. (E) Plotting of Ward’s hierarchical clustering based on the complexity index (K-index) analysis to independently classify NSCs in each condition. (B) The scale bar is 10 μm in (A). *p < 0.05, **p < 0.01, ***p < 0.00. ANOVA repeated measures followed by Bonferroni post hoc test in (B–D).

