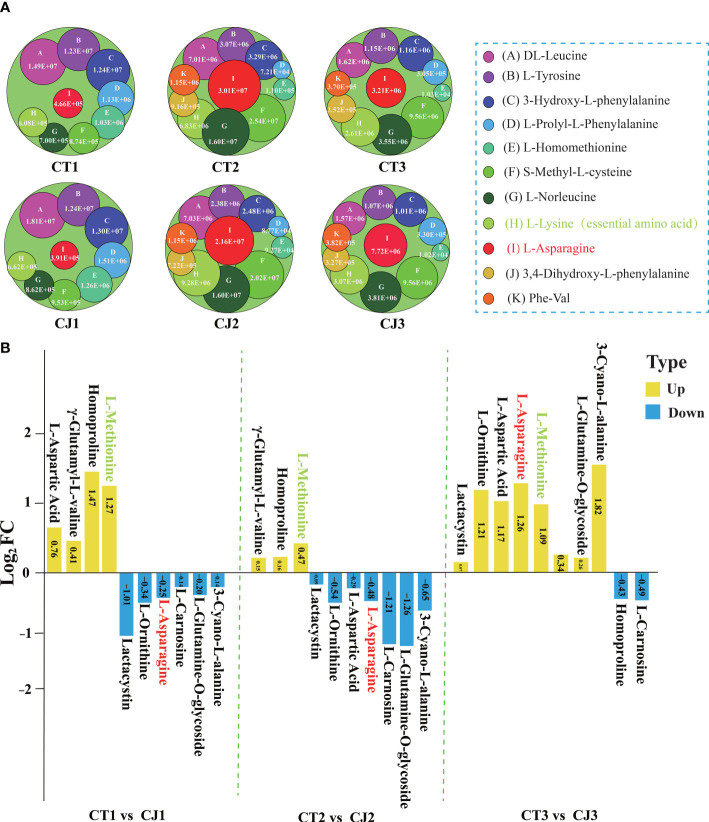
Figure 3.
Differential analysis of 20 AAs affected by different developmental stages and different rootstocks grafting in CT and CJ peels. (A) 11 AAs affected by different developmental periods content variation. A circle represented one amino acid, and A-K represented each of the 11 AAs. The larger the circle, the higher the relative amino acid content. (B) Log2FC value of 10 AAs influenced by different rootstocks grafting in CT1 vs CJ1, CT2 vs CJ2, and CT3 vs CJ3, respectively. The yellow columns indicated that the relative amino acid content was up-regulated and the blue columns represented down-regulated in CT vs CJ. The red text in (A, B) represented amino acid affected by both developmental stages and rootstock grafting. The green text represented essential amino acid.

