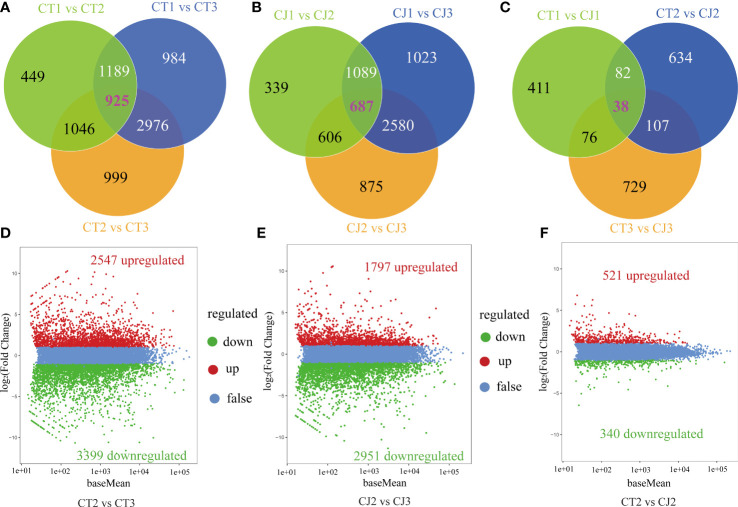
Figure 5.
Analysis of DEGs enrichment pathways and expression patterns. (A-C) Venn diagrams of DEGs in CT and CJ peels. (D-F) Volcano plot of DEGs in CT2 vs CT3, CJ2 vs CJ3 and CT2 vs CJ2, respectively. Red dots indicating the upregulated genes, green dots indicating the downregulated genes, and blue dots indicating the genes with no change significantly.

