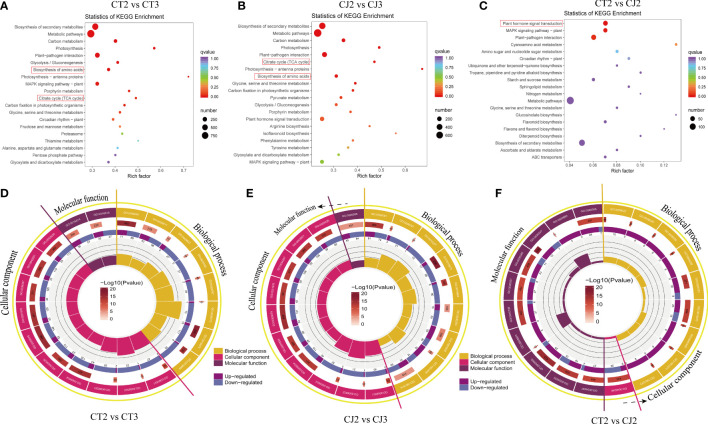
Figure 6.
Analysis of DEGs enrichment pathways and expression patterns. (A-C) Kyoto encyclopedia of genes and genomes (KEGG) enrichment bubble diagrams of DEGs in CT2 vs CT3, CJ2 vs CJ3 and CT2 vs CJ2, respectively. Bubble size indicating the number of DEGs enriched in this KEGG pathway; bubble color indicating the P-values. (D-F) GO enrichment circle diagram of DEGs in CT2 vs CT3, CJ2 vs CJ3 and CT2 vs CJ2, respectively. The outside lap represents the top 20 GO terms; the mid lap represents the numbers of all genes in GO terms and P-values for gene enrichment for the specified GO term; and the inner lap represents the numbers of DEGs. The ladder column in the center represents the Rich factor of DEGs for each GO term.

