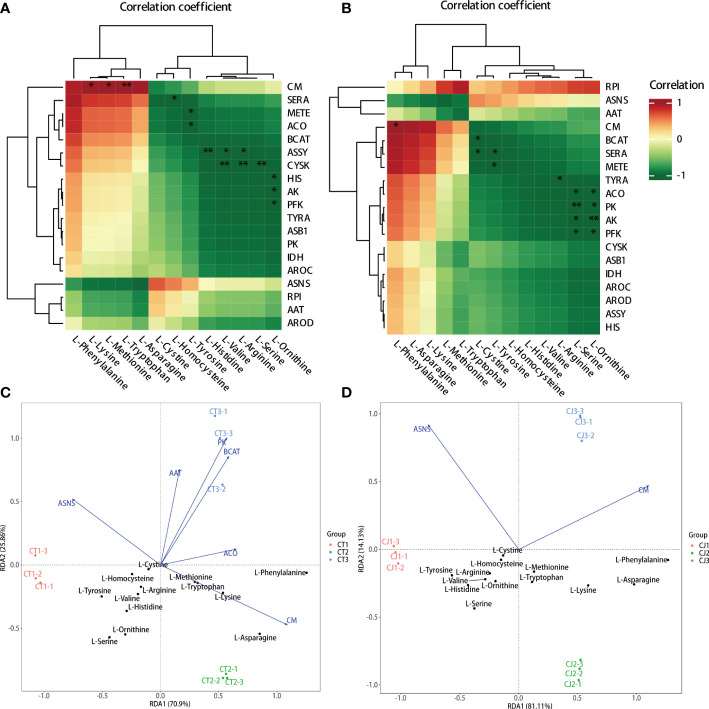
Figure 8.
Correlation analysis and redundancy analysis (RDA) of amino acids and synthetic genes in amino acid biosynthesis pathway. (A, B) Intergroup analysis of amino acids and synthetic genes in CT and CJ, respectively. (C, D) RDA of amino acids and synthetic genes in CT and CJ, respectively. * represents p<0.05; ** represents p<0.01.

