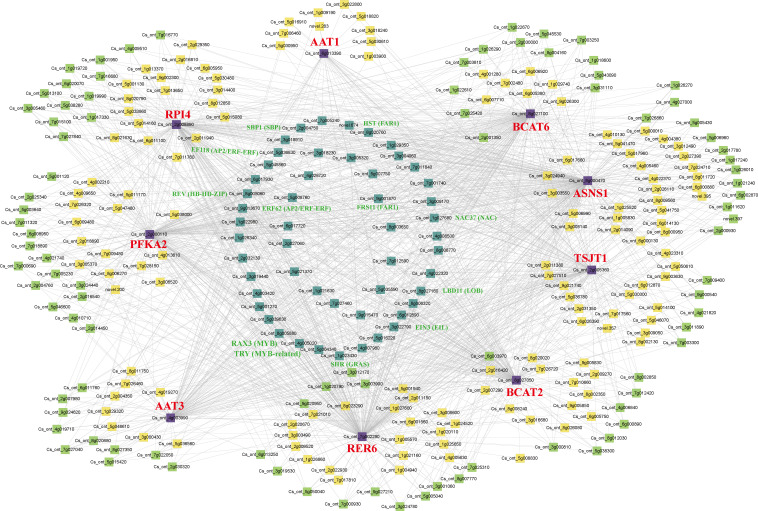
Figure 9.
Co-expression network of structural genes with TFs in the brown module. The different colors represent the degree of connectivity. The purple represents structural genes. The cyan represents a high correlation with at least seven structural genes. The green shows associations with five or six structural genes. The yellow is associated with less than four structural genes.

