
Figure 3.
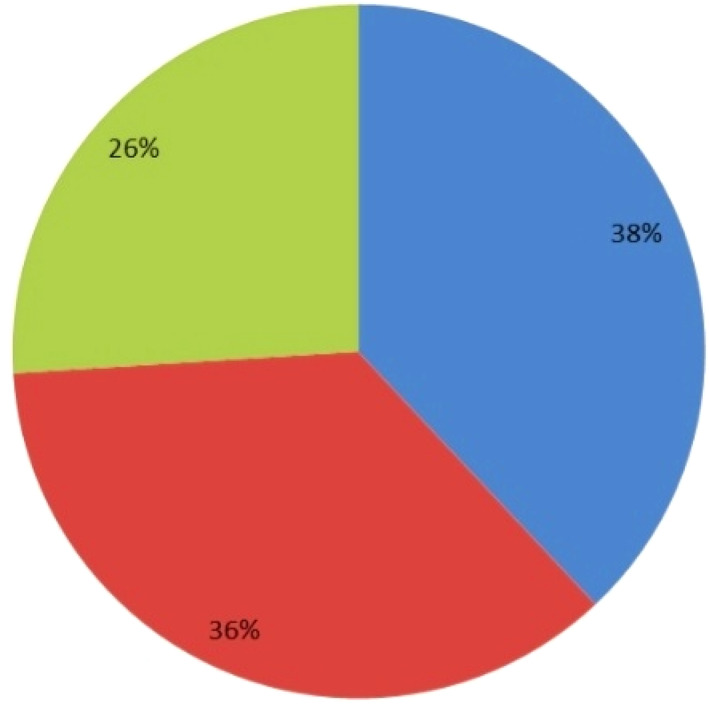
Total bilirubin levels for patients with obstructive jaundice and bacteriobilia. ( ), <10 (n = 19); (
 ), 10–20 (n = 18); (
 ), >20 (n = 13)
Official websites use .gov
A
.gov website belongs to an official
government organization in the United States.
Secure .gov websites use HTTPS
A lock (
) or https:// means you've safely
connected to the .gov website. Share sensitive
information only on official, secure websites.
Total bilirubin levels for patients with obstructive jaundice and bacteriobilia. (), <10 (n = 19); (), 10–20 (n = 18); (), >20 (n = 13)