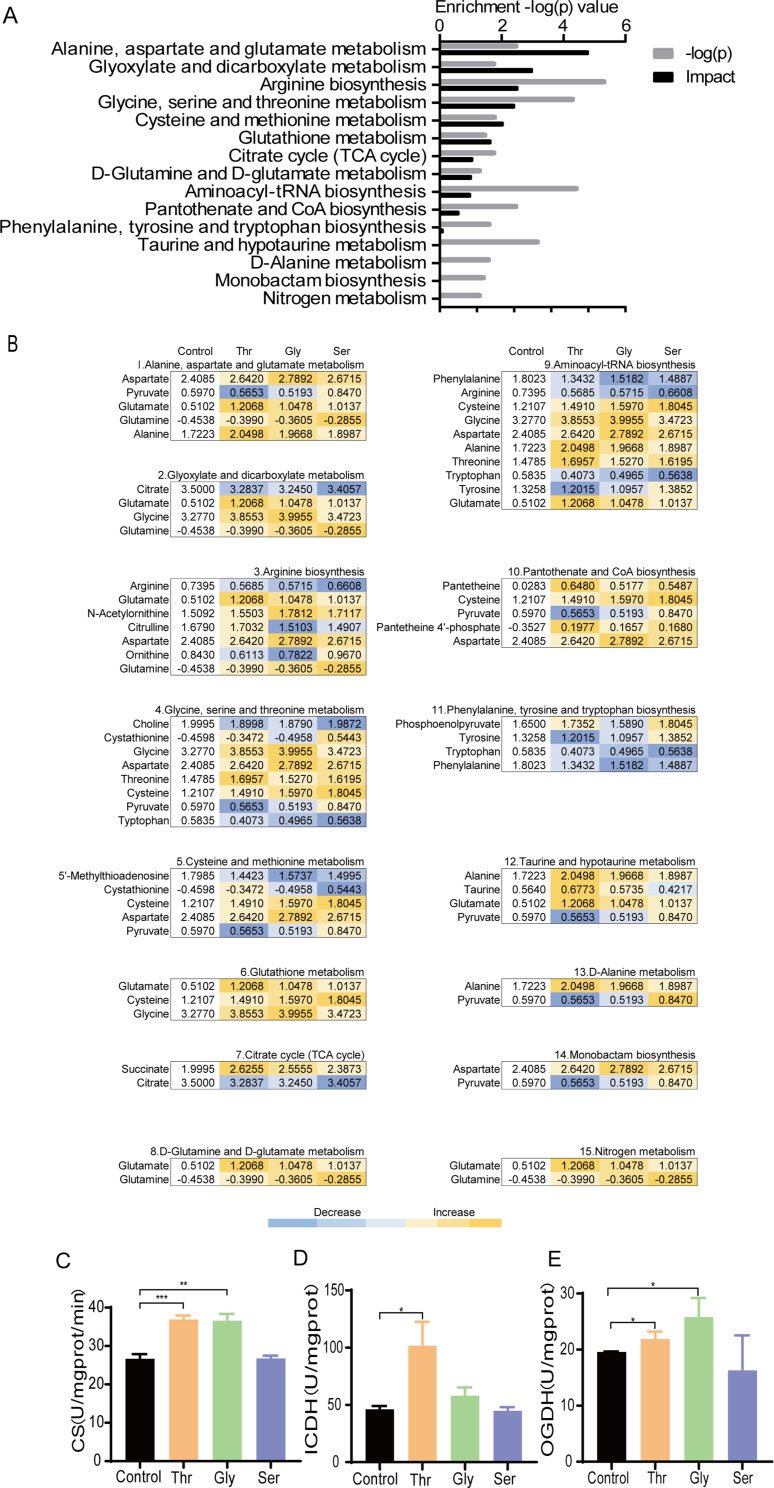
Figure 3.
Threonine, glycine and serine groups have some differences in the relative abundance of metabolites and the TCA cycle was more active in the threonine and glycine groups than in the serine group. (A) Enriched metabolic pathways shared by Thr group, Gly group, and Ser group. Select and analyze differentially abundant metabolites to enrich pathways in MetaboAnalyst 5.0 (https://pathways.embl.de). The fifteen pathways that had significant difference (p < 0.05) were enriched and sorted by their weights (impact). (B) Differential metabolites in enriched pathways. Scales are shown in the lower right, where blue indicates decreased relative abundance of differential metabolites and yellow indicates increased relative abundance of differential metabolites. Lighter colors represent less increase or decrease, darker colors represent more increase or decrease. (C–E) Activity of citrate synthase (CS), isocitrate dehydrogenase (ICDH) and α-ketoglutarate dehydrogenase (OGDH) were detected with 200 μM the Thr, Gly, and Ser, respectively. All data are displayed as mean ± SEM. *p < 0.05, **p < 0.01, ***p < 0.001, determined by Student’s t test.

