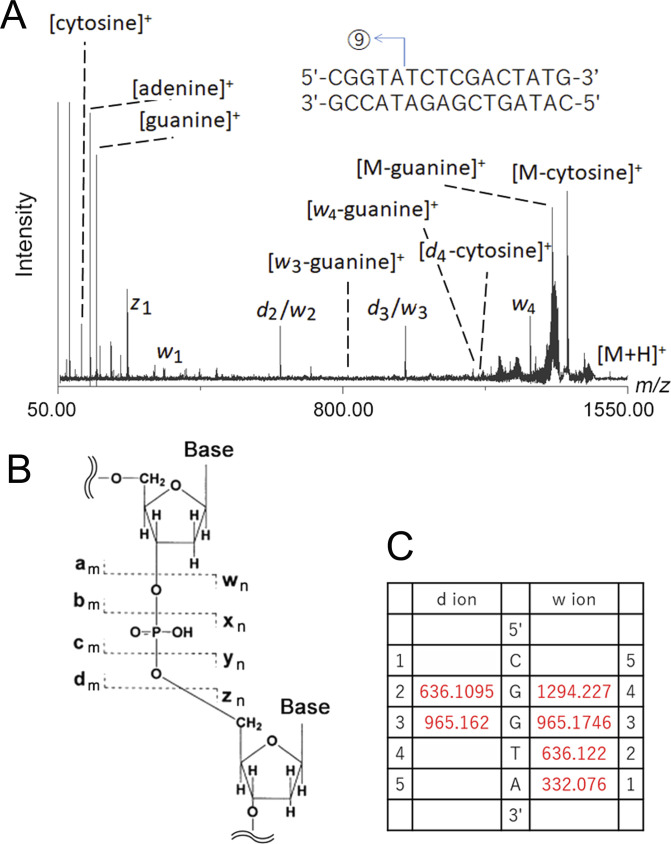
Figure S3. The MS/MS analysis of the DNA fragment #9 (1,503.5 D: 5′-CGGTA-3′) in Fig 2.
(A) The MS/MS spectrum of the DNA fragment. The cleavage event that generated the parental ion is illustrated in the inset. (B) A schematic representation for the ion species. The a to d and z to w ions contain the 5′ and 3′ ends of the parental ion, respectively. The a to d and z to w indicate which site of the phosphodiester bond was cleaved by the MS/MS. The numbers (i.e., m and n) indicate the number of residues in each fragment. For example, d2 and w3 ions correspond to the fragments 5′-CG-3′ and 5′-GTA-3′, respectively. (C) Theoretical masses of the d and w ions that were identified in the MS/MS analysis. The d2 and w2 have nearly the same masses and are indistinguishable from each other; the same is true for d3 and w3. These results show that the fragment (5′-CGGTA-3′) contained a 3′-OH group.

