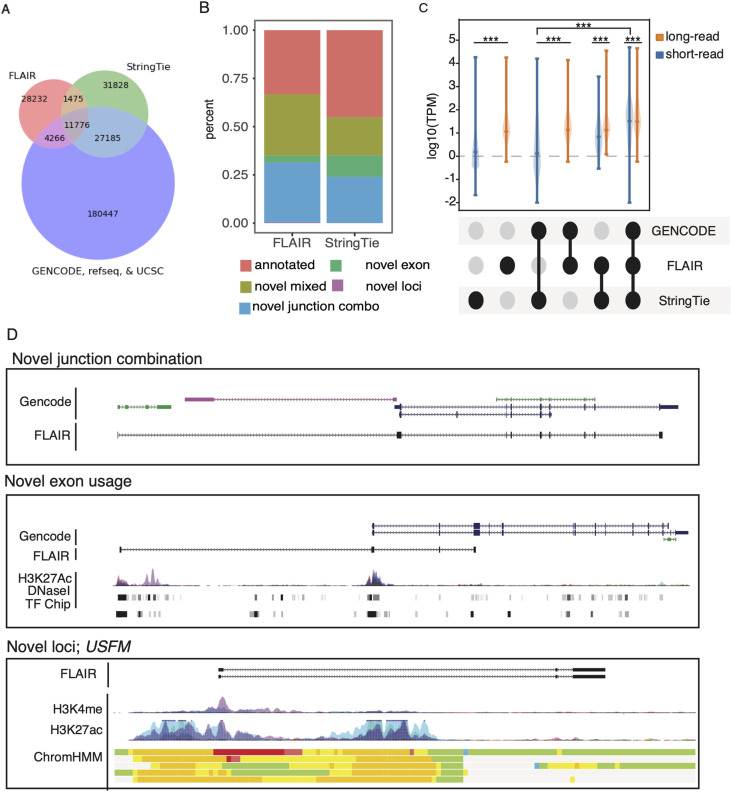
Figure 2. Full-Length Alternative Isoform analysis of RNA (FLAIR) captures HBEC3kt transcriptome complexity.
(A) Transcript isoform overlap between short-read StringTie assembly, GENCODE annotation, and FLAIR isoforms. (B) Isoform annotation categories for FLAIR and StringTie isoforms in comparison to GENCODE v19 annotations. (C) Normalized transcript isoform expression levels across overlapping categories between long-read FLAIR, short-read StringTie assembly, and GENCODE annotation. Expression distributions were compared using Wilcoxon rank-sum test, and comparisons denoted with *** have P-values <0.001. (D) UCSC Genome Browser shot example for novel classification categories. For each panel, GENCODE annotations represent GENCODE v19 basic annotation set. Encode regulatory tracks were included to show H3K27 acetylation, DNase hypersensitivity, transcription factor binding ChIP (TF Chip), and ChromHMM data from various cell lines. Red and yellow hues represent putative promoter regions; green regions represent putative transcribed regions.

