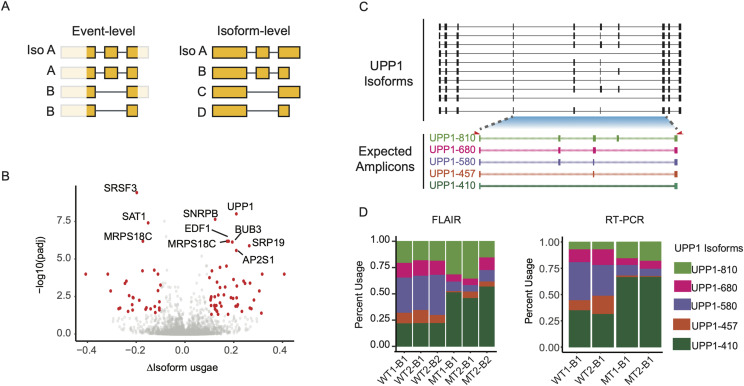
Figure 4. U2AF1 S34F–associated full-length isoform usage changes.
(A) Diagram of event-level versus isoform-level analyses captured by long-read sequencing alterations. (B) Volcano plot of differentially used isoforms. Red dots indicate usage changes with corrected P-value <0.05 and magnitude change >10%. Gene names indicate top 10 genes with significant isoform changes. (C) UPP1 Full-Length Alternative Isoform analysis of RNA major isoforms (top panel) and predicted amplicons (bottom panel). Isoform numbers correspond to predicted amplicon sizes. Red arrows below major isoforms represent PCR primers used for RT–PCR validation. (D) Long-read isoform usage quantified by nanopore data (left panel) and RT–PCR (right panel).

