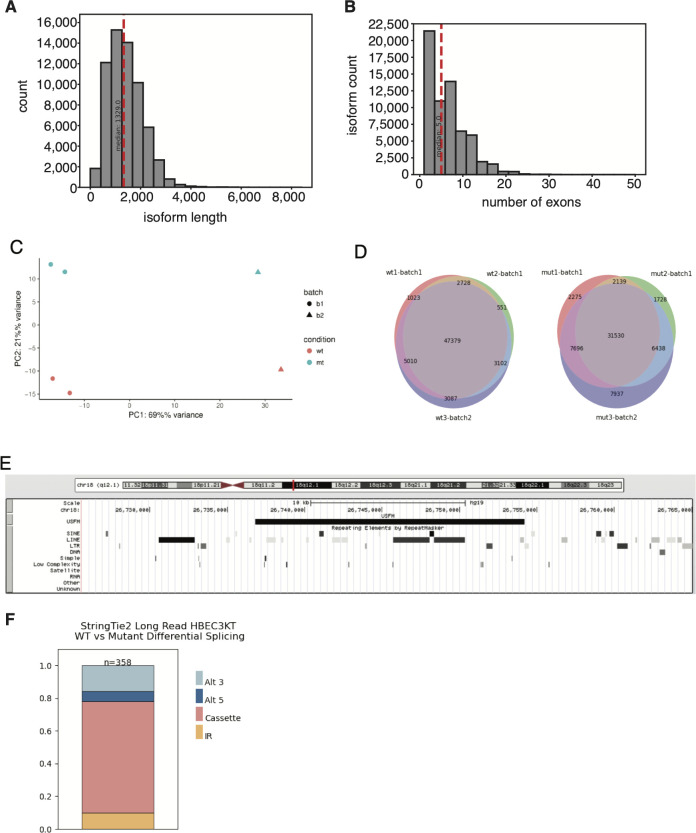
Figure S1. Sequencing library stats and characteristics.
(A) Full-Length Alternative Isoform analysis of RNA (FLAIR) transcript isoforms length distributions. Red line denotes median length. (B) Distribution of exon numbers across FLAIR isoforms. (C) Principal component analysis derived from sequencing depth-normalized isoform counts. (D) FLAIR isoform overlap across biological replicates. (E) UCSC Genome Browser image showing genomic region for up-regulated in splicing factor mutant, including the Repeat Browser track indicating overlaps with repeat elements. (F) Distribution of alternative splicing events associated with U2AF1 mutation when using StringTie2-generated isoforms.

