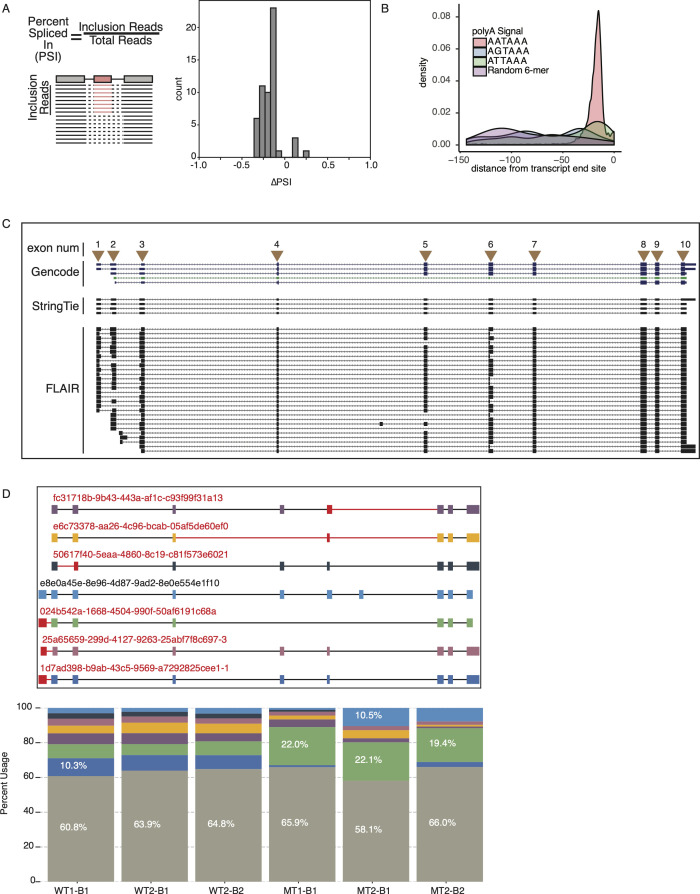
Figure S2. Long-read splicing, polyadenylation, and isoform characteristics.
(A) Diagram of percent spliced in calculation (left). Distribution of percent spliced in values for exon skipping events between U2AF1 S34F mutants versus WT. (B) Polyadenylation signal K-mer relative to 3′ end of Full-Length Alternative Isoform analysis of RNA (FLAIR) transcript isoforms. (C) Genome browser diagram showing basic GENCODE V19 annotation set, short-read assembled StringTie isoforms guided by annotation, and FLAIR-assembled isoforms. Arrows indicate exon numbers. (D) Exon–intron structure of top expressed UPP1 FLAIR isoforms. Isoform identifiers are denoted in red above each transcript diagram. Red exons (thick boxed) and red introns (thin lines) indicate novel exon–intron connectivity not identified in GENCODE or short-read assembly. Stacked bar plot below shows quantification for each isoform (gray bar denotes sum of isoforms with frequency <5%).

