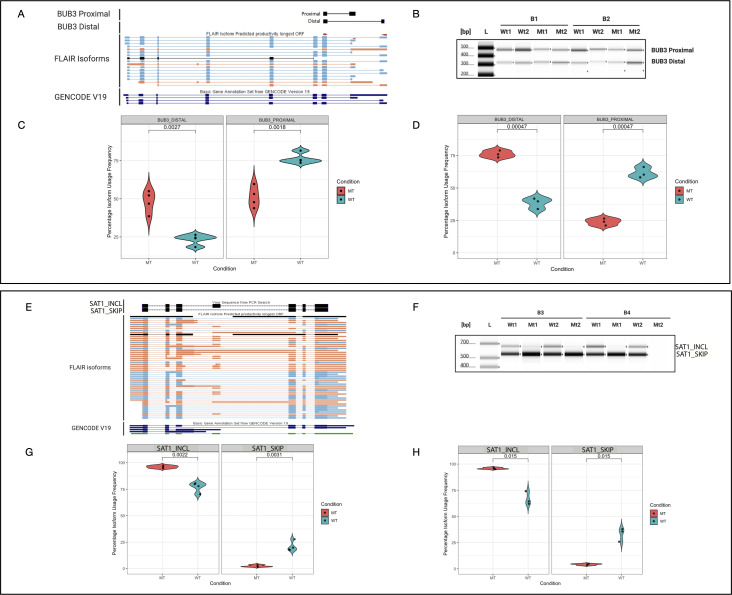
Figure S3. U2AF1 S34F–associated genes with highest isoform usage frequency validation.
(A) Genome browser image of Full-Length Alternative Isoform analysis of RNA (FLAIR) isoforms and GENCODE version 19 annotations including respective amplicons of BUB3 U2AF1 S34F–associated novel transcript alterations. (B) TapeStation ScreenTape image of BUB3 isoforms. BUB3 proximal represents the proximal isoforms and BUB3 distal represents the distal isoforms detected by the nanopore sequencing data. (C) Violin plot of BUB3 distal isoform (left) and proximal isoform (right) for the TapeStation results, t test P-values <0.05. (D) Violin plot of BUB3 proximal and distal isoforms’ isoform usage frequency. (E) Genome browser image of FLAIR isoforms and GENCODE version 19 annotations including respective amplicons of SAT1 U2AF1 S34F–associated novel transcript alterations. (F) TapeStation ScreenTape gel image of SAT1 isoforms. (G) Violin plot of SAT1 isoforms’ usage frequency for TapeStation results. (H) Violin plot for SAT1 nanopore sequencing results. (I) UCSC Genome Browser image of FLAIR isoforms and GENCODE version 19 annotations including respective amplicons of SRSF3 U2AF1 S34F–associated novel transcript alterations. (J) TapeStation ScreenTape gel image of SRSF3 amplicons where each band represents more than one isoform as observed by amplicon size in the gel image. (K) Violin plot of SRSF3 isoforms’ usage frequency for TapeStation results. Note: there were not enough observations to plot SRSF3_867 and SRSF3_1205 mutant and WT isoforms. (L) Violin plot of SRSF3 isoforms’ usage frequency for nanopore sequencing results. (M) Genome browser image of FLAIR isoforms and GENCODE version 19 annotations including EDF1 full-length transcript isoforms amplicons. (N) TapeStation ScreenTape gel image of EDF1 isoforms showing the isoforms’ amplicon sizes. (O) Violin plot of EDF1 isoforms’ usage frequency for TapeStation results. (P) Violin plot of EDF1 isoforms’ usage frequency for nanopore sequencing results. (Q) Genome browser image of FLAIR isoforms and GENCODE version 19 annotations including respective amplicons of SRP19 U2AF1 S34F–associated novel transcript alterations. (R) TapeStation ScreenTape gel image of SRP19 isoforms. Note: two isoform bands are too close to dissociate into different bands (isoforms). (S) Violin plot of SRP19 isoforms’ usage frequency for TapeStation results (SRP19_640 band is too close to SRP19_716 band thus is read as one isoform). (T) Violin plot of SRP19 isoforms’ usage frequency for nanopore sequencing results. (U) Genome browser image of FLAIR isoforms and GENCODE version 19 annotations including MRPS18C full-length transcript isoforms amplicons. (V) TapeStation ScreenTape gel image of MRSP18C isoforms. (W) Violin plot of MRSP18C isoforms’ usage frequency for TapeStation results. (X) Violin plot of MRSP18C isoforms’ usage frequency for nanopore sequencing results. (Y) Genome browser image of FLAIR isoforms and GENCODE version 19 annotations including primer amplicons of respective TPD52L1 U2AF1 S34F–associated novel transcript alterations. (Z) TapeStation ScreenTape gel image of TPD52L1 isoforms showing the full-length transcript isoforms length and the actual reading from amplicons. Note: the difference in length is because that amplicons only include a section of targeting exons not whole exons from the nanopore sequencing results. (AA) Violin plot of TPD52L1 isoforms’ usage frequency for TapeStation results. (AB) Violin plot of TPD52L1 isoforms’ usage frequency for nanopore sequencing. (AC) Full TapeStation ScreenTape gel image of UPP1 isoforms associated with Fig 4.

