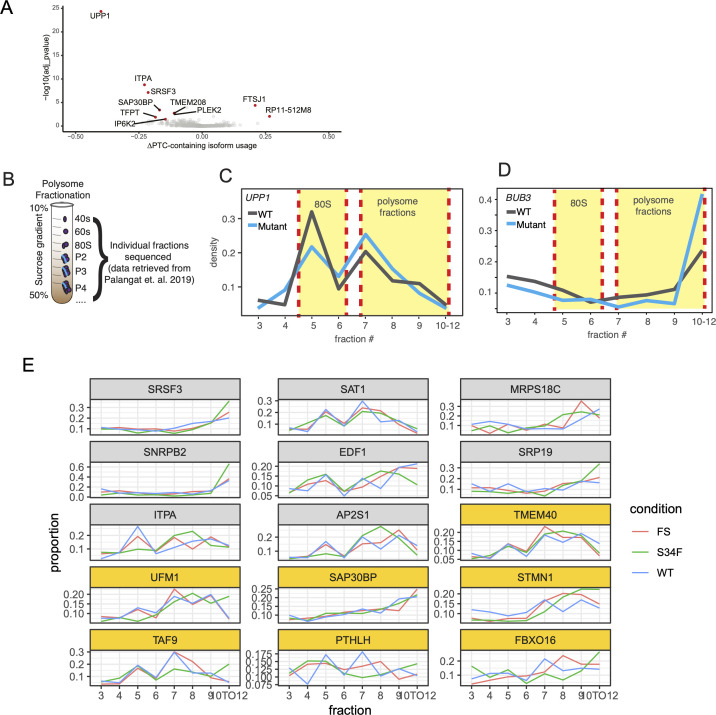
Figure S5. Results from productivity and polysome profile analyses.
(A) Differential isoform usage for premature termination codon–containing isoforms. Genes highlighted in red indicate genes with significant change in isoform usage (P adj <0.05 and usage change >10%). (B) Polysome profiling analysis and sequencing scheme. (C) UPP1 expression density of normalized read counts across polysome fractions. Yellow highlights indicate 80 s and polysome fractions. (D) Same as panel (C) for BUB3. (E) Polysome profiles for genes identified in this study as significantly dysregulated. Genes marked in yellow boxes were observed to have significant alternative polyadenylation usage.

