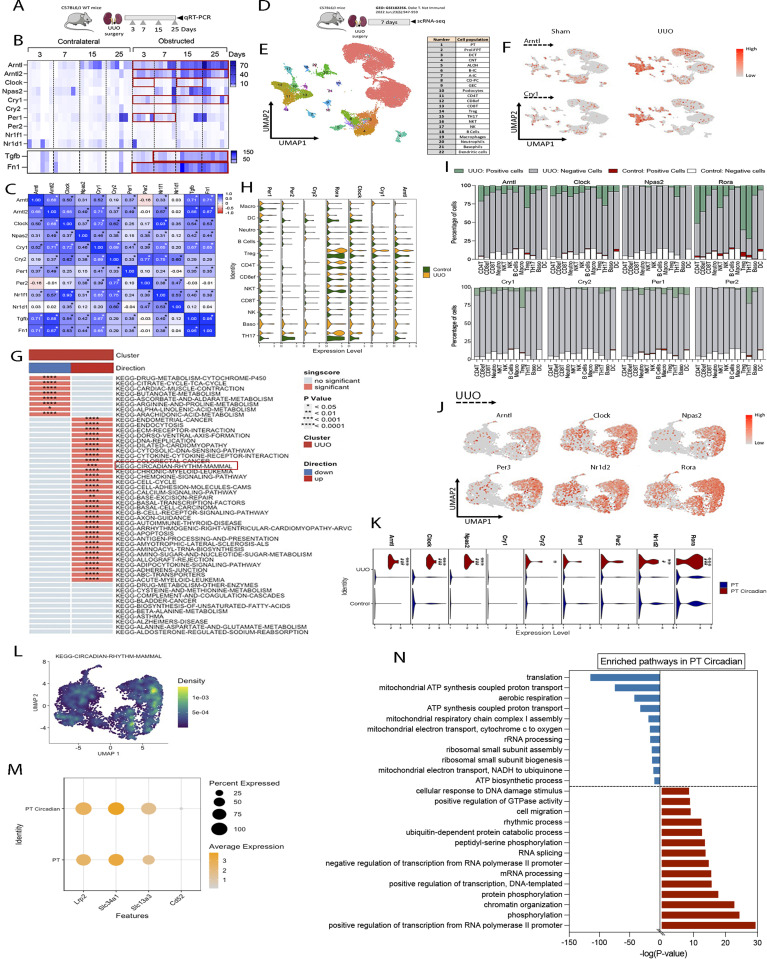
Figure 1. The molecular clock pathway is up-regulated in altered PT cells after kidney damage.
(A) Schematic of experimental design of WT mice subjected to unilateral ureteral obstruction (UUO) for 3, 7, 15, and 25 d. (A, B) Heat map represents the mRNA expression of molecular clock genes and fibrotic markers in kidneys from mice described in (A) (n = 6 per condition), red rectangles denote significant differences compared with contralateral kidneys (Wilcoxon test). (B, C) Spearman r correlation of the data represented in (B), *P < 0.05. (D) Schematic of experimental design of the scRNA-seq data obtained from the dataset GSE182256. (E) UMAP dimension reduction of cells showing 22 distinct cell types identified by unsupervised clustering. GEC, glomerular endothelial cell; ALOH, ascending loop of Henle; DCT, distal convoluted tubule; CNT, connecting tubule; CD PC, collecting duct principal cell; A-IC, α-intercalated cell; B-IC, β-intercalated cell; prolif PT, proliferating PT. (F) Feature plot shows the expression of Arntl and Cry1 in the different cell types identified. (G) Heat map represents the up-regulated and down-regulated gene sets in immune cells from sham and UUO kidneys. (H) Violin plots represent the expression of molecular clock genes in immune cell–related clusters. (I) Bar plots represent the distribution of immune cells regarding the molecular clock gene expression. (J) UMAP plots showing the expression of molecular clock genes in PT cells from UUO kidneys. (K) Violin plots represent the expression of molecular clock genes in PT and PT Circadian cells, #P < 0.01, ###P < 0.001 compared with PT cells from control; *P < 0.05, **P < 0.01, ***P < 0.001 compared with PT cells from UUO (Wilcoxon test). (L) Density plot shows the expression and distribution of “KEGG-CIRCADIAN-RHYTHM” in PT cells from UUO kidneys in Ucell on UMAP plot. (M) Dot plot represents the expression of proximal tubular epithelial cells markers in PT circadian and PT cells from UUO. (N) Gene Ontology annotation of the top up-regulated and down-regulated pathways in PT circadian versus PT cells from UUO kidneys. The data were obtained from DAVID and represented as the −log(P-Value).

