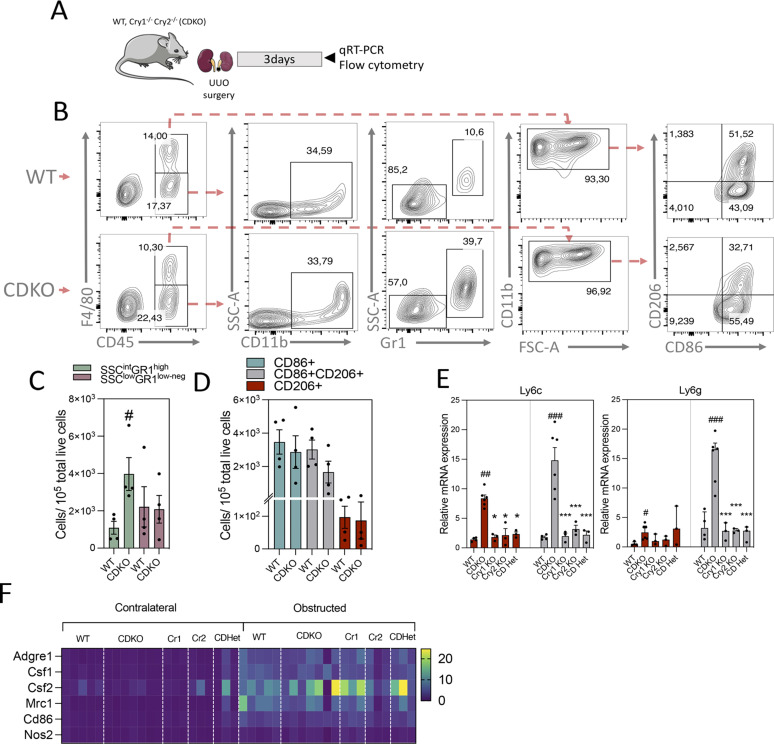
Figure 4. The inflammatory response of CDKO mice is associated with an increased presence of neutrophils.
(A) Schematic of experimental design of WT Cry1/Cry2 KO mice subjected to unilateral ureteral obstruction (UUO) for 3 d. (B) Flow cytometry dot plots denoting the percentage of myeloid cell populations in kidneys from WT (n = 4) and CDKO (n = 4) mice. (B, C) Bar plots represent the FACS quantification of the number of neutrophils (SSCintGR1high) and monocytes (SSClowGR1low-neg) from the analysis shown in (B). (B, D) Bar plots represent the FACS quantification of the number of different macrophage subpopulations based on the expression of CD86 and CD206 from the analysis shown in (B). (E) Bar plots represent the relative mRNA expression of Ly6c and Ly6g in kidneys from WT, CDKO, Cry1 KO, Cry2 KO, and CDHet mice subjected to UUO for 3 d. (F) Heat map of normalized expressions of macrophage-related markers in kidneys from WT, CDKO, Cry1 KO, Cry2 KO, and CDHet mice subjected to UUO for 3 d. Number of mice: WT (n = 5), CDKO (n = 6), Cry1 (n = 3), Cry2 (n = 3), and CDHet (n = 3) mice. #P < 0.05, ##P < 0.01, ###P < 0.001 compared with the WT. ***P < 0.001 compared with the CDKO (Mann–Whitney).

