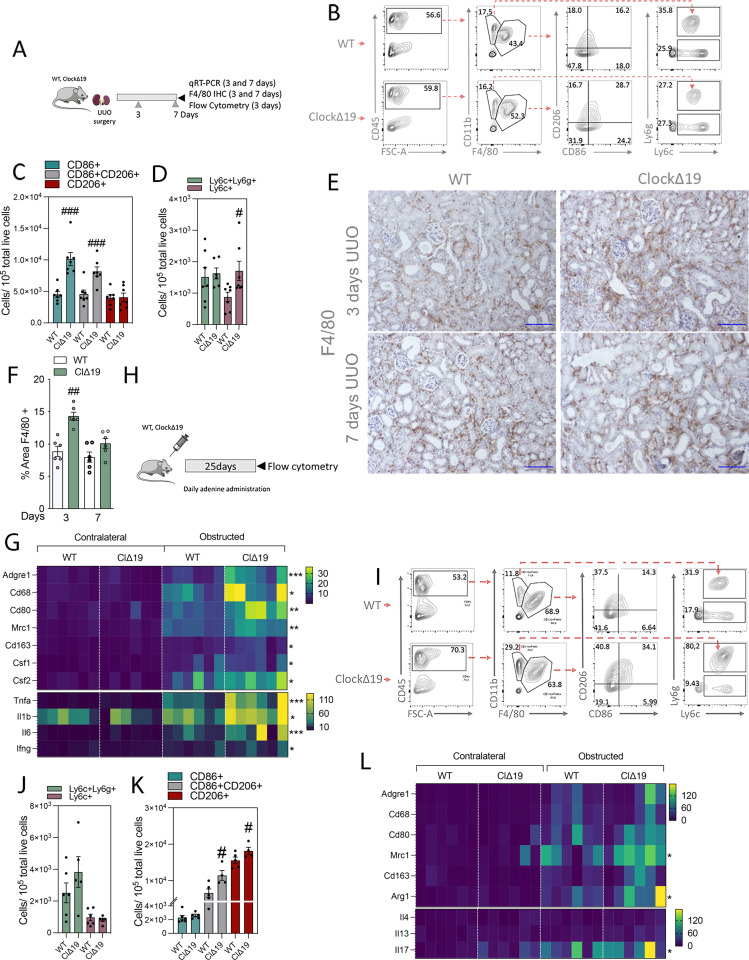
Figure 5. ClockΔ19 mice exhibit an increase in the number of macrophage and monocyte populations in the early and late phases of inflammation.
(A) Schematic of experimental design of WT and ClockΔ19 mice subjected to unilateral ureteral obstruction (UUO) for 3 d. (B) Flow cytometry dot plots denoting the percentage of myeloid cell populations in kidneys from WT (n = 6) and ClockΔ19 (n = 6) mice. (B, C) Bar plots represent the FACS quantification of the number of different macrophage subpopulations based on the expression of CD86 and CD206 from the analysis shown in (B). (B, D) Bar plots represent the FACS quantification of the number of neutrophils (Ly6c+Ly6g+) and monocytes (Ly6c+Ly6g−) from the analysis shown in (B). (E) Representative pictures of F4/80 immunohistochemistry stain of contralateral and obstructed kidneys of WT and ClockΔ19 mice 3 and 7 d after UUO. Scale bar: 150 μm. (E, F) Quantification of F4/80 immunohistochemistry in obstructed kidney sections of mice denoted in (E). (G) Heat map of normalized expressions of inflammatory-related genes in kidneys from WT and ClockΔ19 mice 3 d after UUO. (H) Schematic of experimental design of WT and ClockΔ19 mice subjected to adenine-induced nephropathy for 25 d. (I) Flow cytometry dot plots denoting the percentage of myeloid cell populations in kidneys from WT (n = 5) and ClockΔ19 (n = 6) mice. (I, J) Bar plots represent the FACS quantification of the number of neutrophils (Ly6c+Ly6g+) and monocytes (Ly6c+Ly6g−) from the analysis shown in (I). (I, K) Bar plots represent the FACS quantification of the number of different macrophage subpopulations based on the expression of CD86 and CD206 from the analysis shown in (I). (L) Heat map of normalized expressions of inflammatory-related genes in kidneys from WT and ClockΔ19 mice 7 d after UUO. #/*P < 0.05, ##/**P < 0.01 ###/***P < 0.001 compared with WT (Mann–Whitney).

