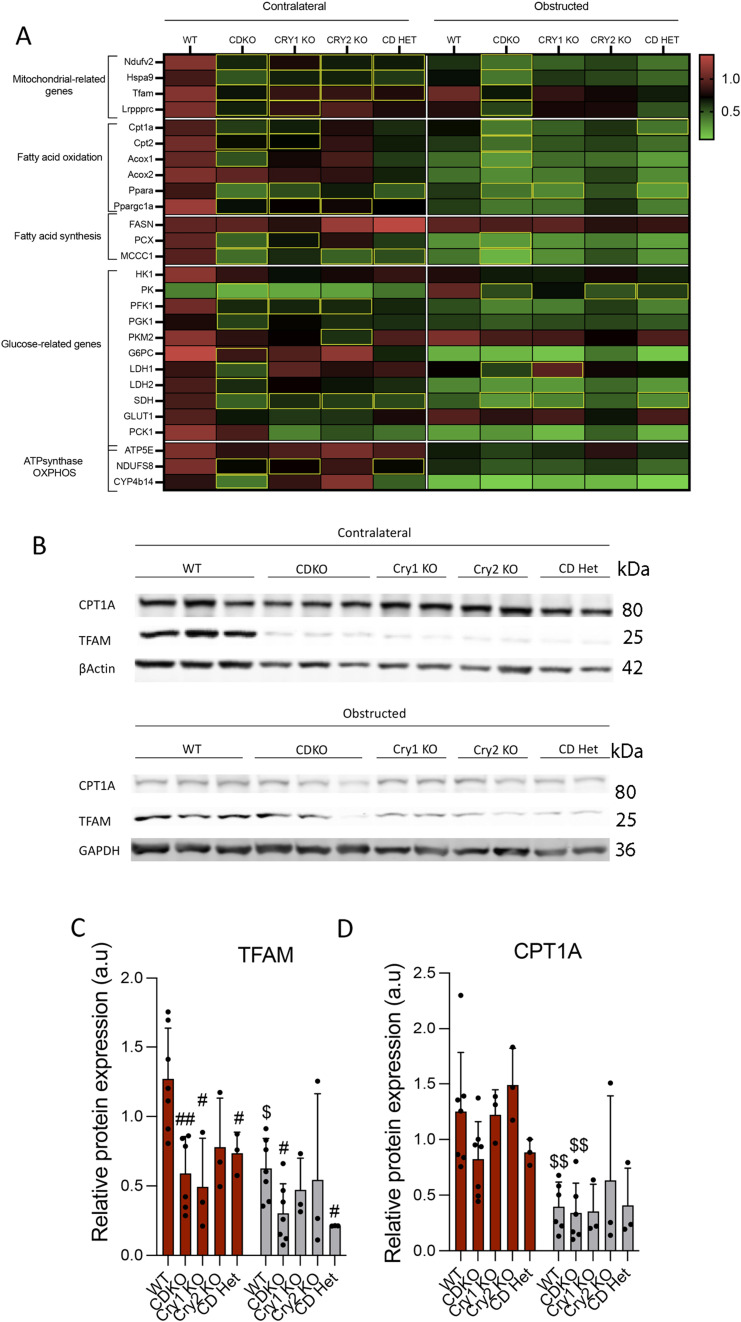
Figure 6. The expression profile of metabolism and mitochondrial-related genes is significantly altered in CDKO mice.
(A) Heat map of normalized expressions of metabolism and mitochondrial-related genes in CDKO mice, in kidneys 3 d after unilateral ureteral obstruction. (B) Immunoblot depicting the expression of Cpt1a and Tfam proteins in kidneys from mice with the different Cry1- and Cry2-defective genotypes, 3 d after unilateral ureteral obstruction; β-actin and GAPDH levels were used for normalization. (B, C, D) Relative protein expression of (C) TFAM and (D) CPT1A from the immunoblots shown in (B). Number of mice: WT (n = 5), CDKO (n = 6), Cry1 KO (n = 3), Cry2 KO (n = 3). (A) Yellow rectangles denote significant differences compared with kidneys from WT mice (Mann–Whitney). (C, D) $P < 0.05, $$P < 0.01 compared with their respective contralateral kidney; #P < 0.05, ##P < 0.01 compared with the WT (Mann–Whitney).
Source data are available for this figure.

