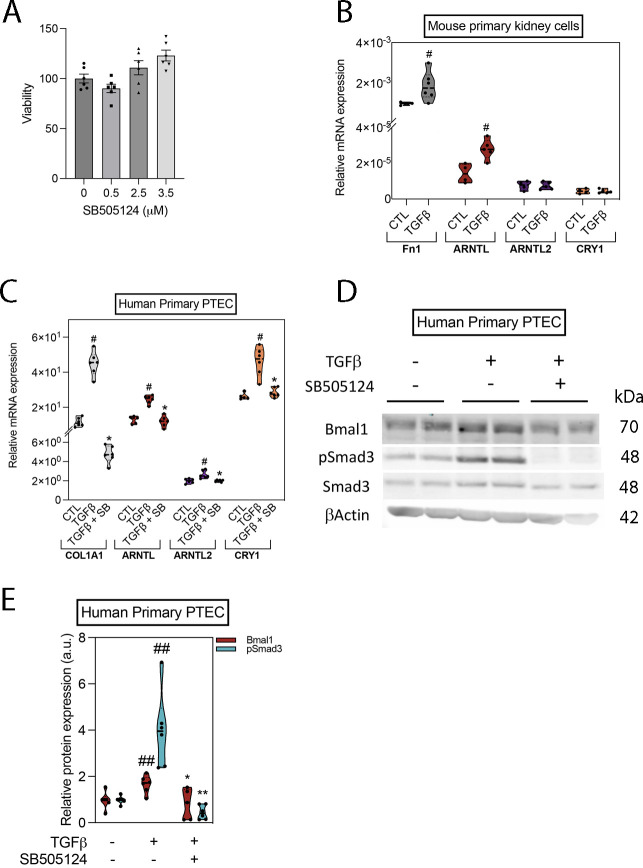
Figure S3. The expression of molecular clock components is up-regulated by TGFβ in primary mouse kidney cells and in HprimPTEC.
(A) MTT assay in human proximal TEC cells treated with 0–3.5 μM SB505124 for 24 h. (B) Relative mRNA levels of Fn1 and molecular clock genes in synchronized mouse primary kidney cells treated with TGFβ for 24 h. Data are represented with violin plots as the median with interquartile range (n = 6 per condition). (C, D, E) Evaluation of the expression of components of the molecular clock in synchronized human primary proximal tubular epithelial cells treated with TGF-β for 24 h in the presence or absence of the selective inhibitor SB505124. (C) Relative mRNA levels of Col1a1 and molecular clock genes. (D) Immunoblots showing the expression of Bmal1, pSmad3, Smad3, and β-actin. β-actin and Smad3 were used for normalization. (D, E) Relative protein expression of Bmal1 and pSmad3 obtained by densitometry of images from (D) and normalized with β-actin and Smad3, respectively. Data are represented with violin plots as the median with interquartile range (n = 6 per condition). #P < 0.05, ##P < 0.01 compared with control without treatments, *P < 0.05, **P < 0.01 compared with TGF-β–treated cells (Mann–Whitney).
Source data are available for this figure.

