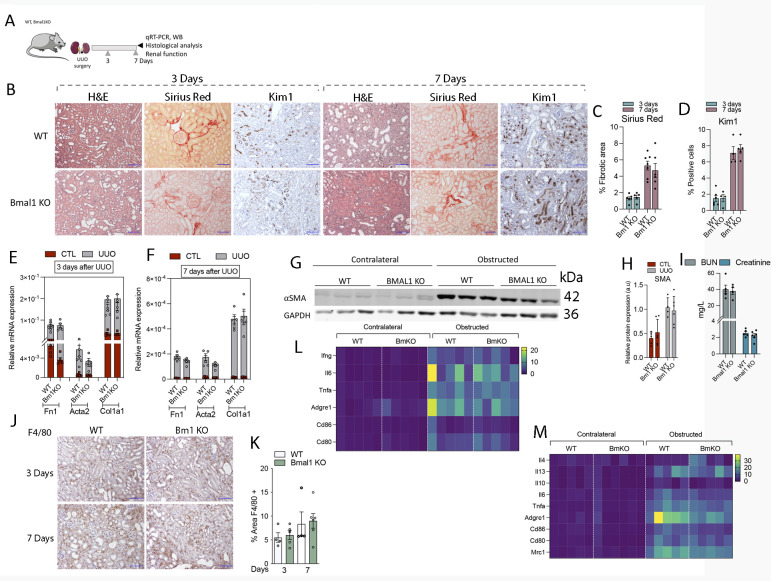
Figure S5. Bmal1 KO mice do not exhibit increased inflammation or fibrosis 3 or 7 d after unilateral ureteral obstruction (UUO).
(A, B) Schematic of experimental design. (B) Representative microphotographs of H&E, Sirius red, and KIM1 immunohistochemistry (IHC) stains from contralateral and obstructed kidneys of Bmal1 KO and WT mice 3 and 7 d after UUO. Scale bar: 150 μm. (C, D, E) Bar plots show the quantification of Sirius red (C) and KIM1 (D) of IHC images shown in (E). (E, F) Bar plots show the relative mRNA expression of fibrosis-related genes in WT and Bmal1 KO mice 3 (E) and 7 (F) d after UUO. (G) Immunoblot depicting the expression of αSMA in kidneys from Bmal1 KO mice 7 d after UUO, GAPDH levels were used for normalization. (H) Bar plot shows the relative protein expression of αSMA in kidneys from Bmal1 KO and WT mice 7 d after UUO. (I) Plasma creatinine and BUN levels of Bmal1 KO mice and their respective WT mice 7 d after UUO. (J) Representative pictures of F4/80 IHC stain of obstructed kidneys of Bmal1 KO and WT mice, 3 and 7 d after UUO. Scale bar: 150 μm. (K) Bar plot shows the quantification of F4/80 IHC images denoted in J from Bmal1 KO and WT mice. (L, M) Heat map of normalized expressions of inflammatory-related genes in kidneys from WT and Bmal1 KO mice (L) 3 and (M) 7 d after UUO. The data are represented as the mean ± s.e.m. (Number of mice: 3 d of UUO: WT [5] and Bmal1 KO [6]; 7 d of UUO: WT [5] and Bmal1 KO [6]).
Source data are available for this figure.

