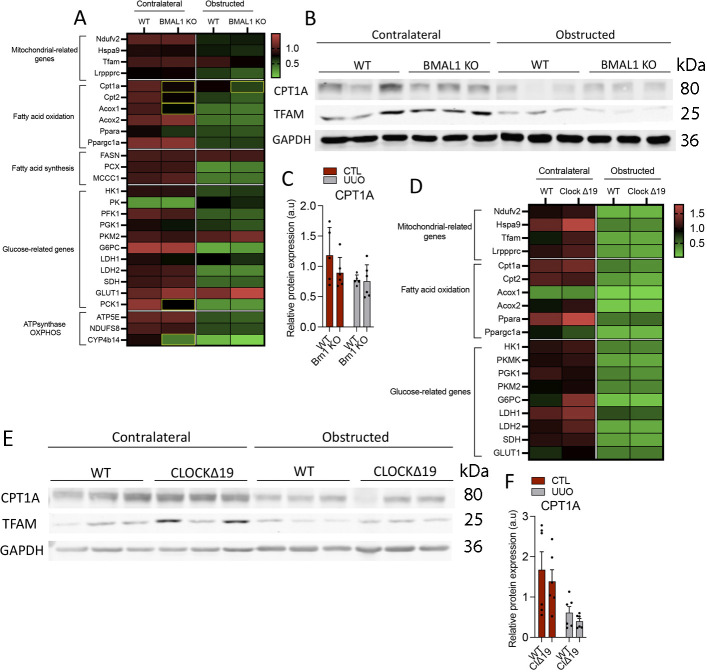
Figure S7. The expression profile of genes related to fatty acid oxidation is significantly altered in Bmal1 KO mice whereas no significant differences were observed in ClockΔ19 mice.
(A) Heat map of normalized expressions of metabolism and mitochondrial-related genes in kidneys from WT and Bmal1 KO mice, 3 d after unilateral ureteral obstruction (UUO). Yellow rectangles denote significant differences compared with kidneys from WT mice (Mann–Whitney). (B) Immunoblot depicting the expression of Cpt1a and TFAM in the kidneys from Bmal1 KO mice 3 d after UUO; GADPH levels were used for normalization. (B, C) Relative protein expression of Cpt1a in the kidneys from Bmal1 KO mice of images in (B). (D) Heat map of normalized metabolism and mitochondrial-related genes in ClockΔ19 mice 3 d after UUO (Mann–Whitney). (E) Immunoblot depicting the expression of Cpt1a and TFAM in the kidneys from ClockΔ19 mice 3 d after UUO; GADPH levels were used for normalization. (E, F) Relative protein expression of Cpt1a in the kidneys from ClockΔ19 mice of images in (E). Data are represented in bar plots as the mean ± s.e.m. (Number of mice: Bmal1 KO mice: WT [5] and Bmal1 KO [6]; ClockΔ19: WT [6] and ClockΔ19 mice [6]).
Source data are available for this figure.

