
Figure 1. Optimal hexanediol application conditions for mESCs are 2% concentration for 5 min.
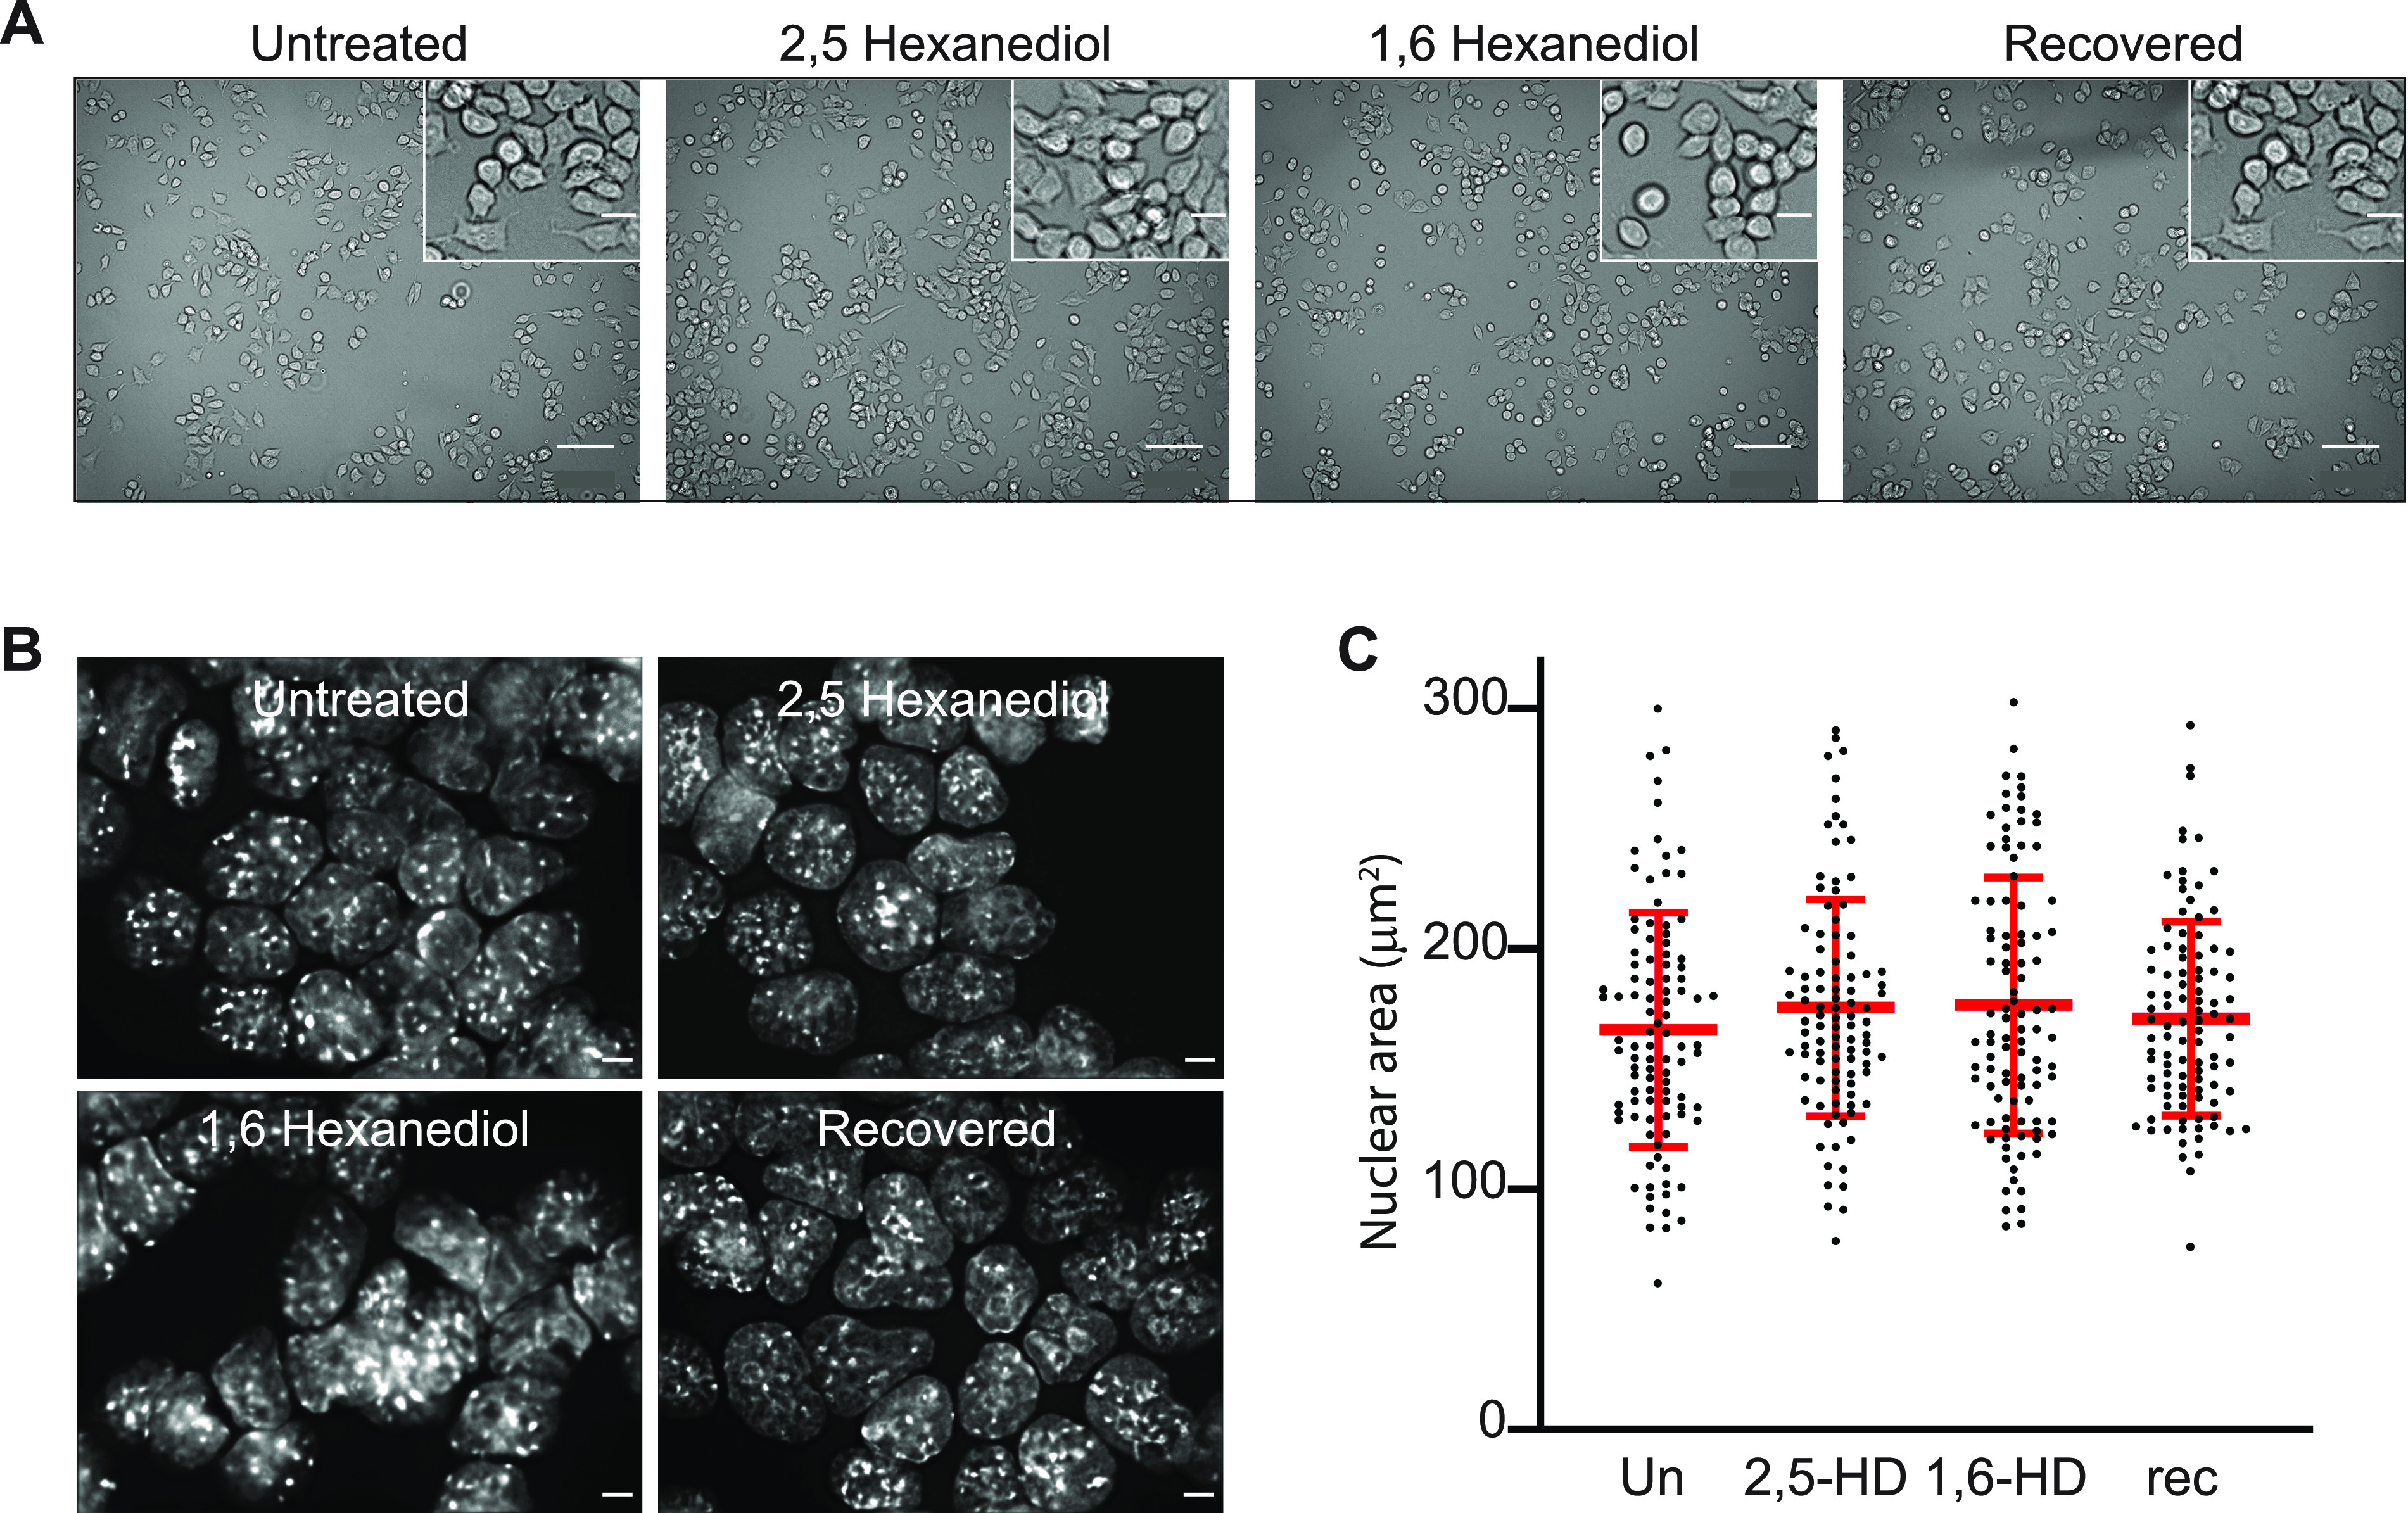
(A) Representative phase contrast images of untreated, 2,5-HD–treated, 1,6-HD–treated, and recovered mESCs. Scale bars: 100 μm. Inset scale bars: 20 μm. (B) Representative images of DAPI-stained untreated, 2,5-HD–treated, 1,6-HD–treated, and recovered mESC nuclei. Scale bars: 5 μm. (C) Scatter plot showing the nuclear areas (μm2) of untreated, 2,5-HD–treated, 1,6-HD–treated, and recovered mESCs (black dots). Red bars show the means and standard deviations. Data sets were tested for differences using the unpaired t test with Welch’s correction. All P-values were ≥0.1. Results from a biological replicate experiment are shown in Fig S1, and the data and statistical evaluation for these figures are in Table S1.