
Figure 2. Reversible chromatin decompaction at the HoxD cluster following 1,6-HD treatment.
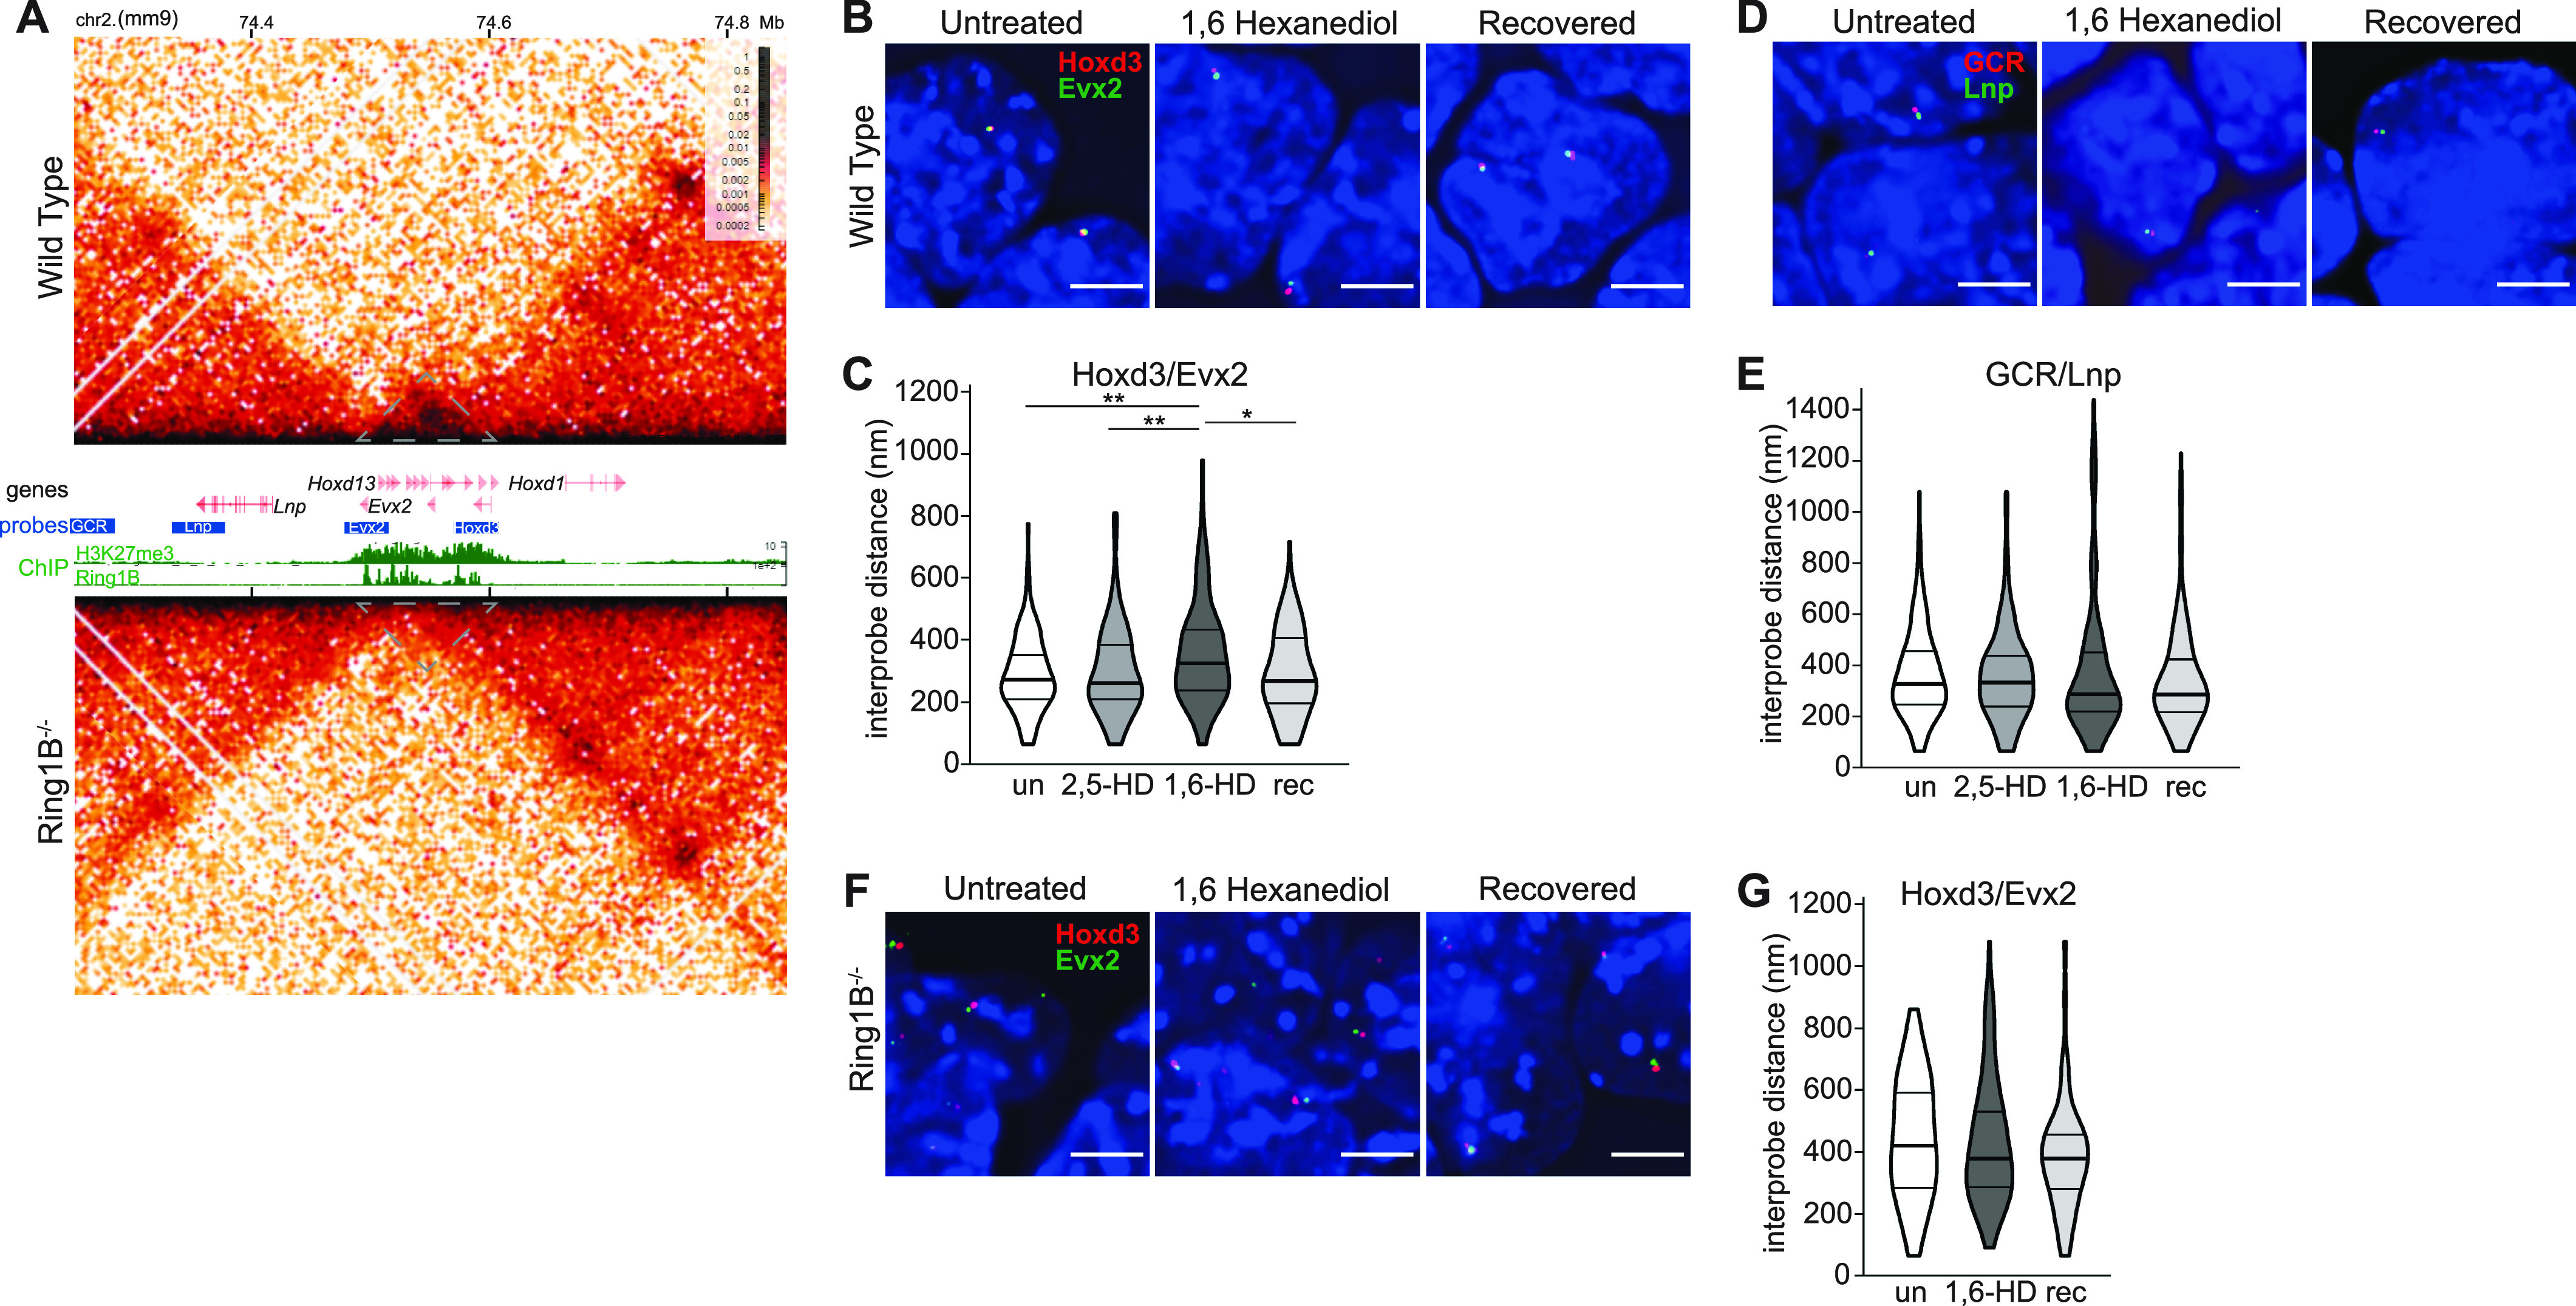
(A) Hi-C maps (5 kb resolution) of the HoxD cluster from wild-type (WT) (top: Ring1B+/+) and (lower) Ring1B−/− mESCs. Genome co-ordinates on chromosome 2 (Mb) from the mm9 assembly of the mouse genome. Genes, fosmid probe–binding locations, H3K27me3, and RING1B ChIP-seq profiles are shown between the two Hi-C maps. Grey dotted triangles indicate the extent of the HoxD locus (data are from the study of Boyle et al [2020]). (B, D) Representative 3D-FISH images for polycomb (B) and non-polycomb (D) target loci at HoxD in untreated, 1,6-HD–treated, and recovered WT mESCs. Scale bars: 5 μm. (C, E) Violin plots show the interprobe distances (nm) for probe pairs used in B, D in untreated, 2,5-HD–treated, 1,6-HD–treated, and recovered WT cells. ∗ P ≤ 0.05 and > 0.01; ∗∗ P ≤ 0.01; Mann–Whitney test. Data for a biological replicate are shown in Fig S2, and data and statistical evaluation are summarised in Table S2. (F, G) As in B, C but using Ring1B−/− mESCs.