
Figure 5. Reversible loss of PRC1-dependent clustering of polycomb targets across chromosome 2 following hexanediol treatment.
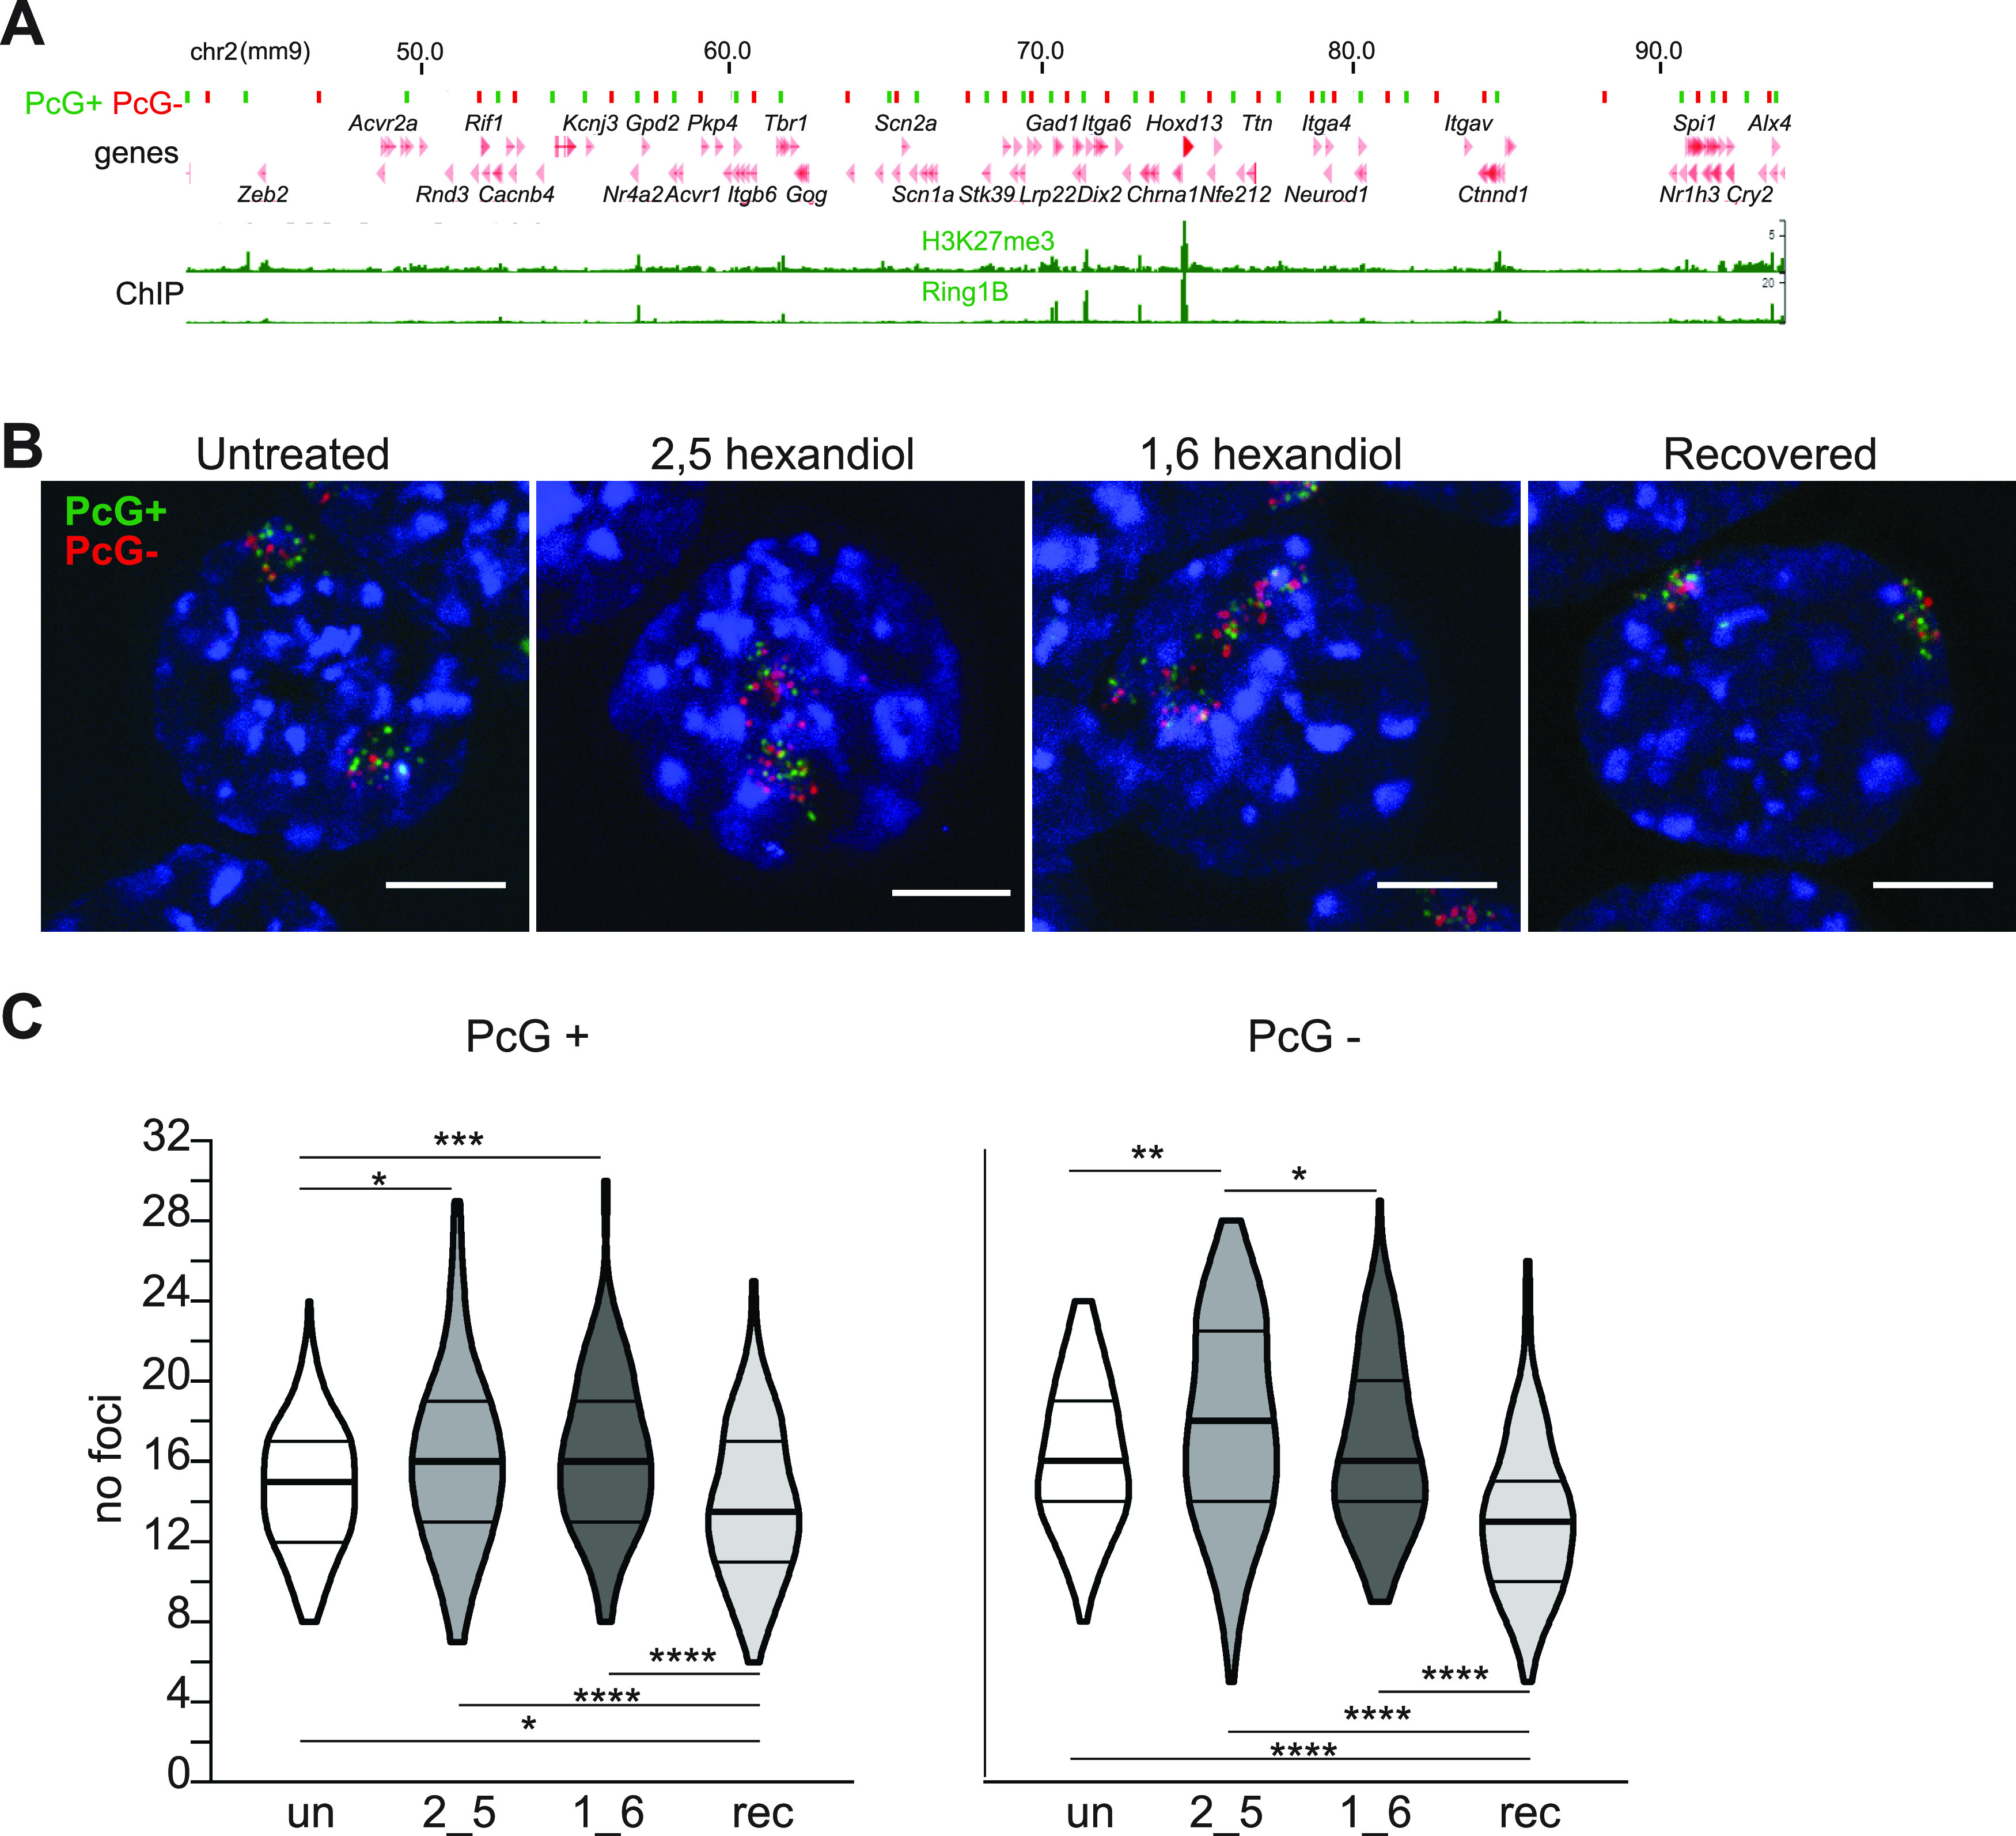
(A) Ideogram of chromosome 2 indicating the location of the oligonucleotide probes used in B, C and zoomed in browser tracks of RING1B and H3K27me3 ChIP-seq from WT mESCs (Boyle et al, 2020). Polycomb-positive (PcG+) and polycomb-negative (PcG−) probe locations are represented as green and red bars, respectively. Genomic co-ordinates (Mb) are for the mm9 genome assembly. (B) Representative 3D-FISH images of untreated, 2,5-HD–treated, 1,6-HD–treated, and recovered cells hybridized with the chromosome 2 PcG+ (green; 6FAM) and PcG− (red; ATT0594) probe pools. Scale bar: 5 μm. (C) Violin plots depicting the number of discrete foci in untreated, 2,5-HD–treated, 1,6-HD–treated, and recovered cells for PcG+ and PcG− probe pools. ∗ P ≤ 0.05 and > 0.01; ∗∗ P ≤ 0.01; ∗∗∗ P ≤ 0.001, ∗∗∗∗ P ≤ 0.0001; Mann–Whitney test. Data are summarised in Table S7.