
Figure 6. Reversible reduction of PRC1 binding to polycomb target loci following hexanediol treatment.
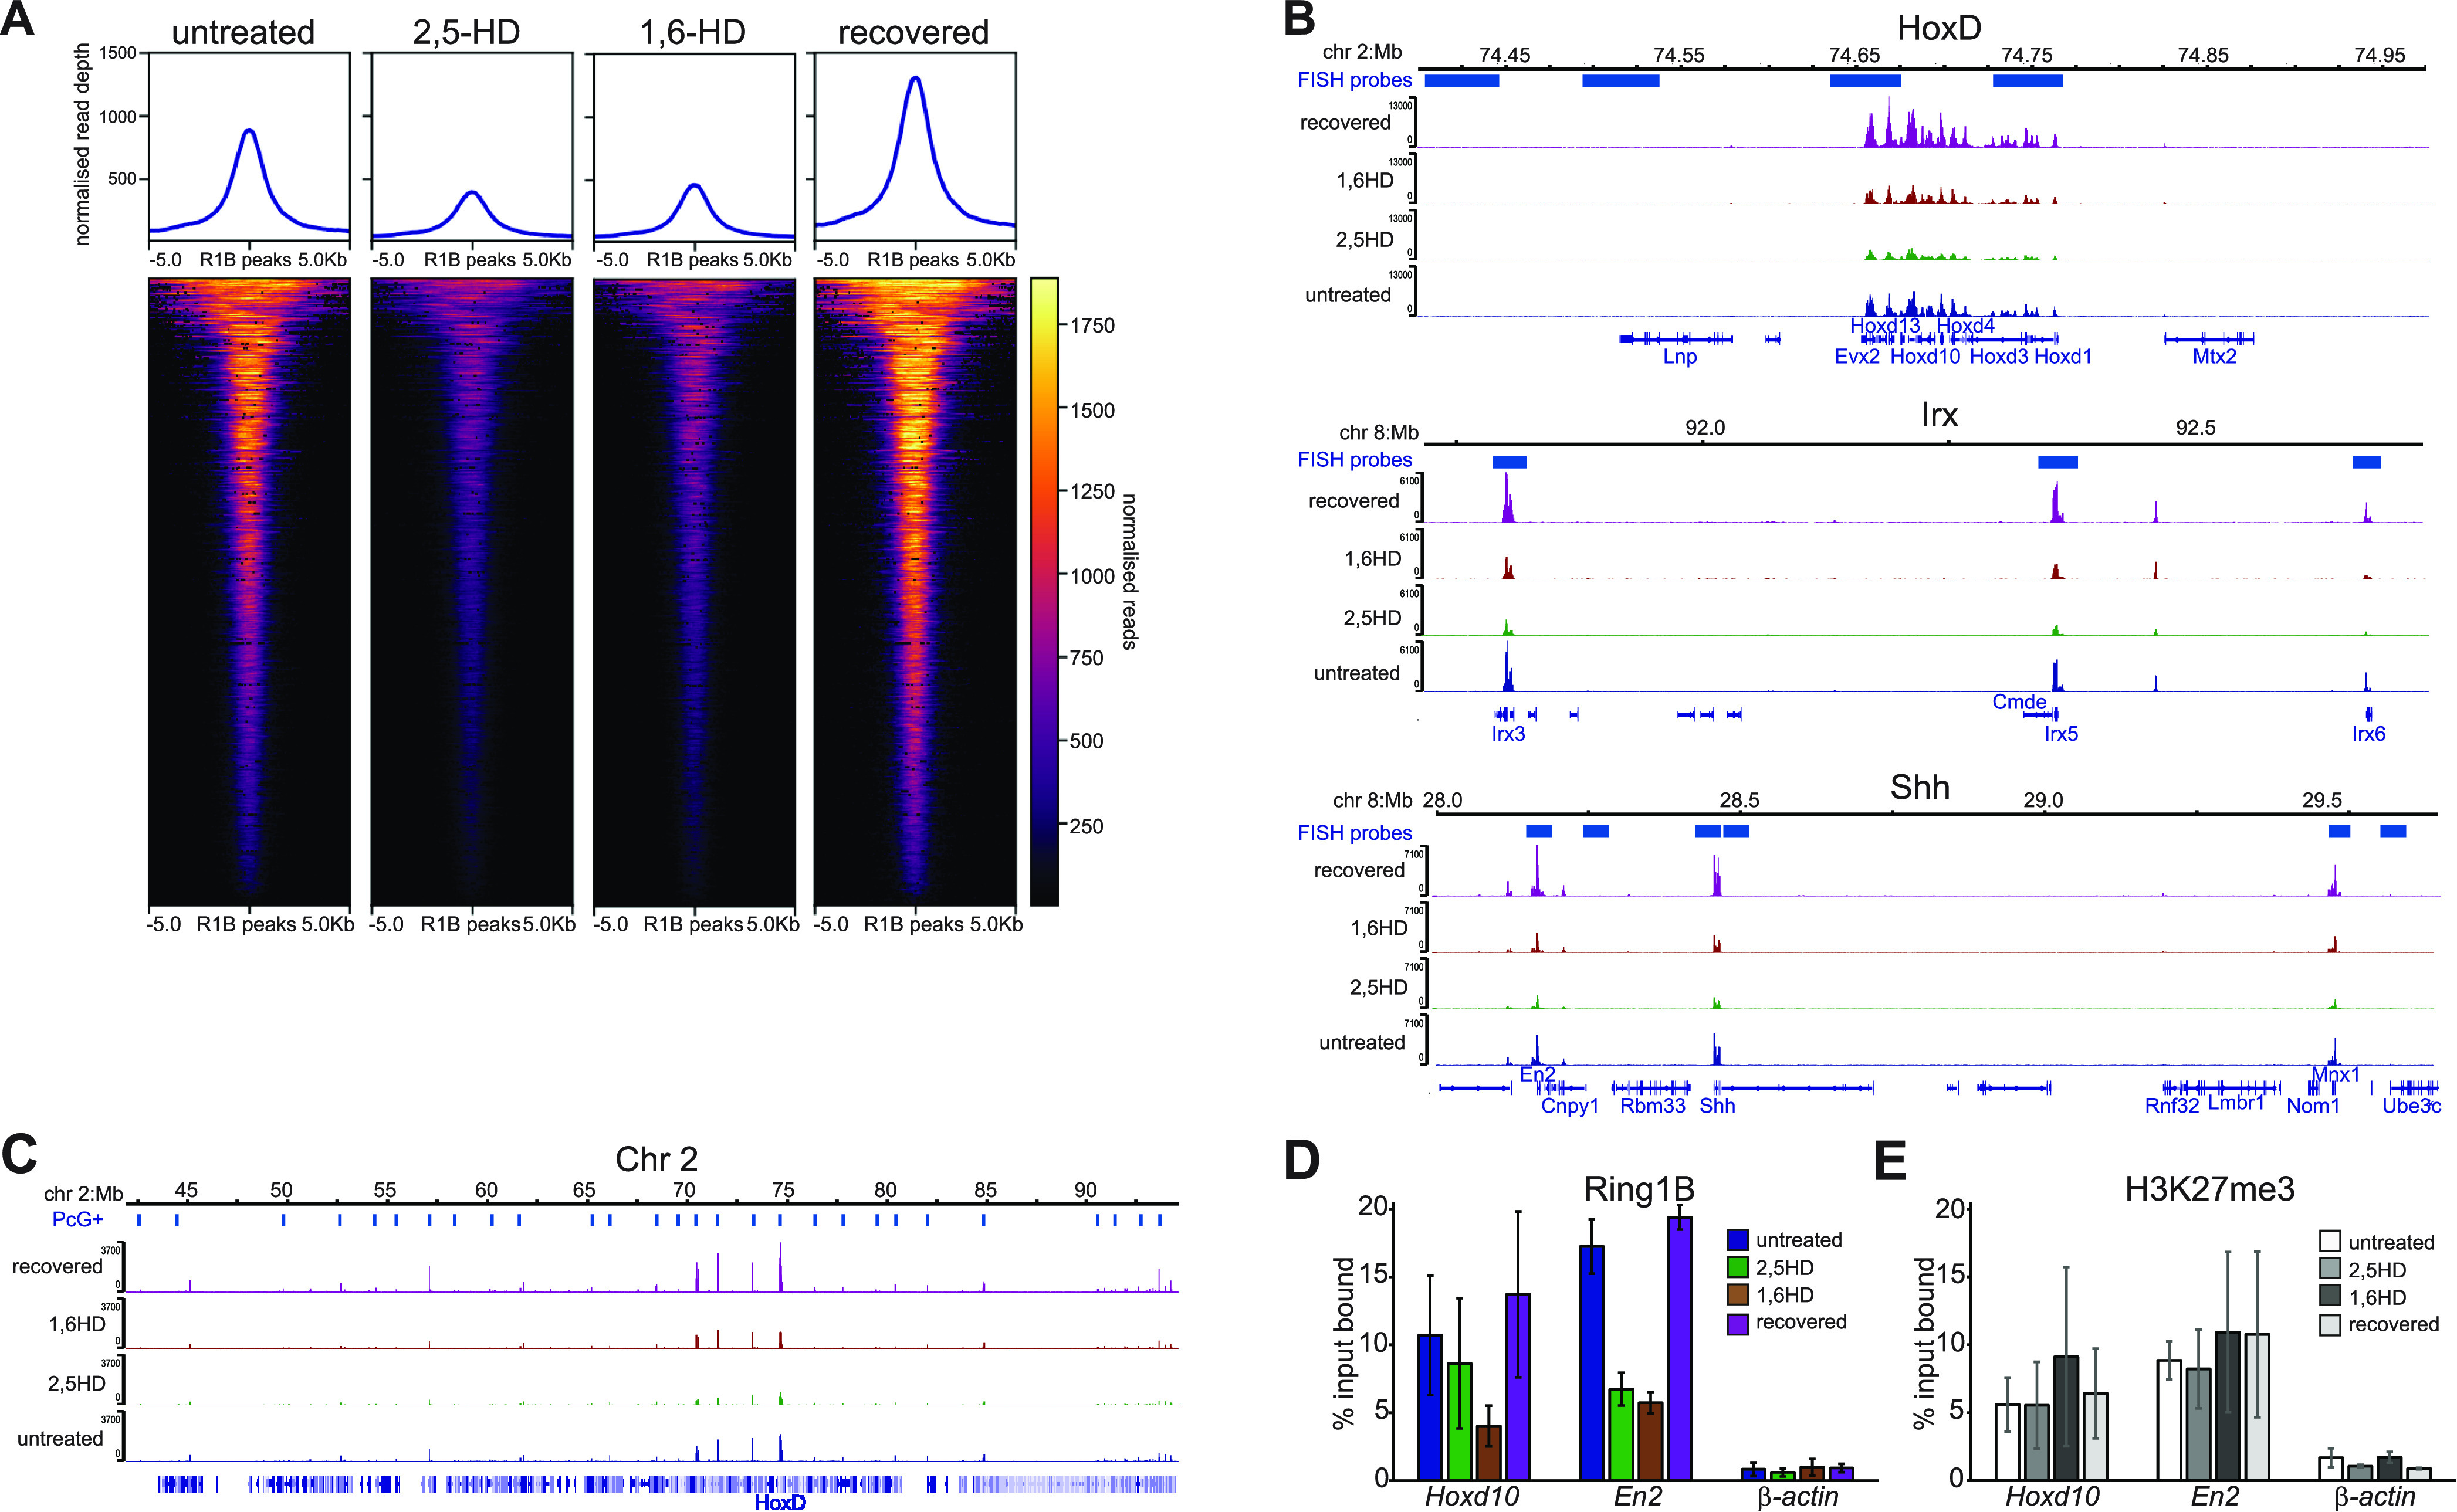
(A) Heatmap representation (bottom panel) and average metaplots (top panel) of RING1B calibrated ChIP-seq signal distribution at merged RING1B peaks in untreated, 2,5-HD–treated, 1,6-HD–treated, and recovered WT mESCs. (B) IGV (Robinson et al, 2011) track views of RING1B cChIP-seq data from untreated, 2,5-HD–treated, 1,6-HD–treated, and recovered mESCs at the HoxD (top), Irx3, 5, 6 (middle), En2, Shh, and Mnx1 (bottom) genomic regions. (C) As for B but for the 50 Mb region of chromosome 2 tiled with oligonucleotide probes. Biological replicate for these data are in Fig S5. Genomic co-ordinates (Mb) are for the mm10 genome assembly. (D, E) qPCR analysis of ChIP for RING1B (D) and H3K27me3 (E) at Hoxd10, En2, and β-actin in untreated, 2,5-HD-treated, 1,6-HD–treated, and recovered mESCs. Enrichment is shown as mean percent input bound ± s.e.m. over two (β-actin) to four biological replicates.