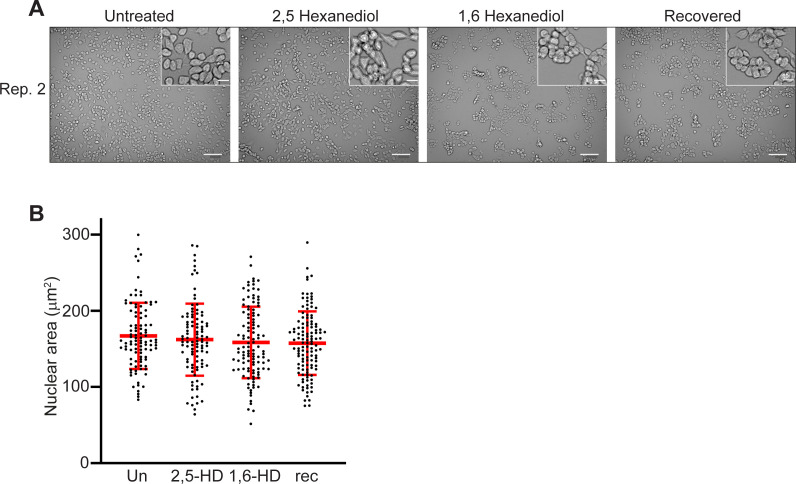
Figure S1. Cell morphology and nuclear size of mESCs—biological replicate of the data in Fig 1.
(A) Representative images of untreated, 2,5-HD–treated, 1,6-HD–treated, and recovered mESCs. Scale bars: 100 μm. Inset scale bars: 20 μm. (B) Scatter plot showing the area of each measured nucleus (black dots) for each cell type. Red bars show the mean and the standard deviations. Data sets were tested for differences using the unpaired t test with Welch’s correction. Data and statistical evaluation for this figure are in Table S1.

