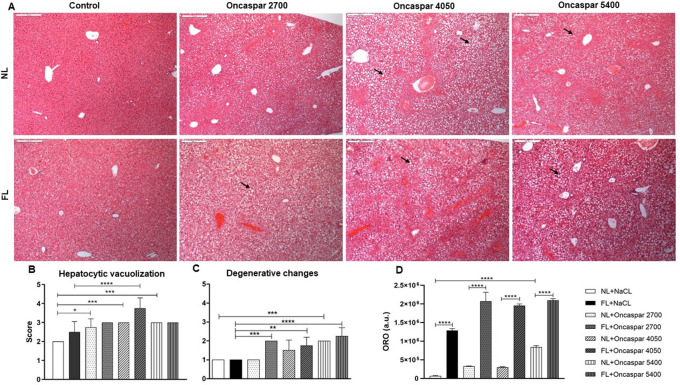
Figure 2. Representative pictures of H&E-stained liver sections at the 4-day time point (100×).
Arrows refer to hepatocytic vacuolization (A). Evaluation of hepatocytic vacuolization (B), degenerative changes (C) and Oil Red O (ORO) staining (D) of liver sections are shown as means± SD. Arbitrary units (a.u.). * p < 0.05, ** p < 0.01, *** p < 0.001, **** p< 0.0001.

